
The Opportunity Economy
Eight reports this month, one map: the layers India can build and own — sized, ranked and mostly upstream of the platform. June named the problem; July prices the opportunity.
The issue at a glance
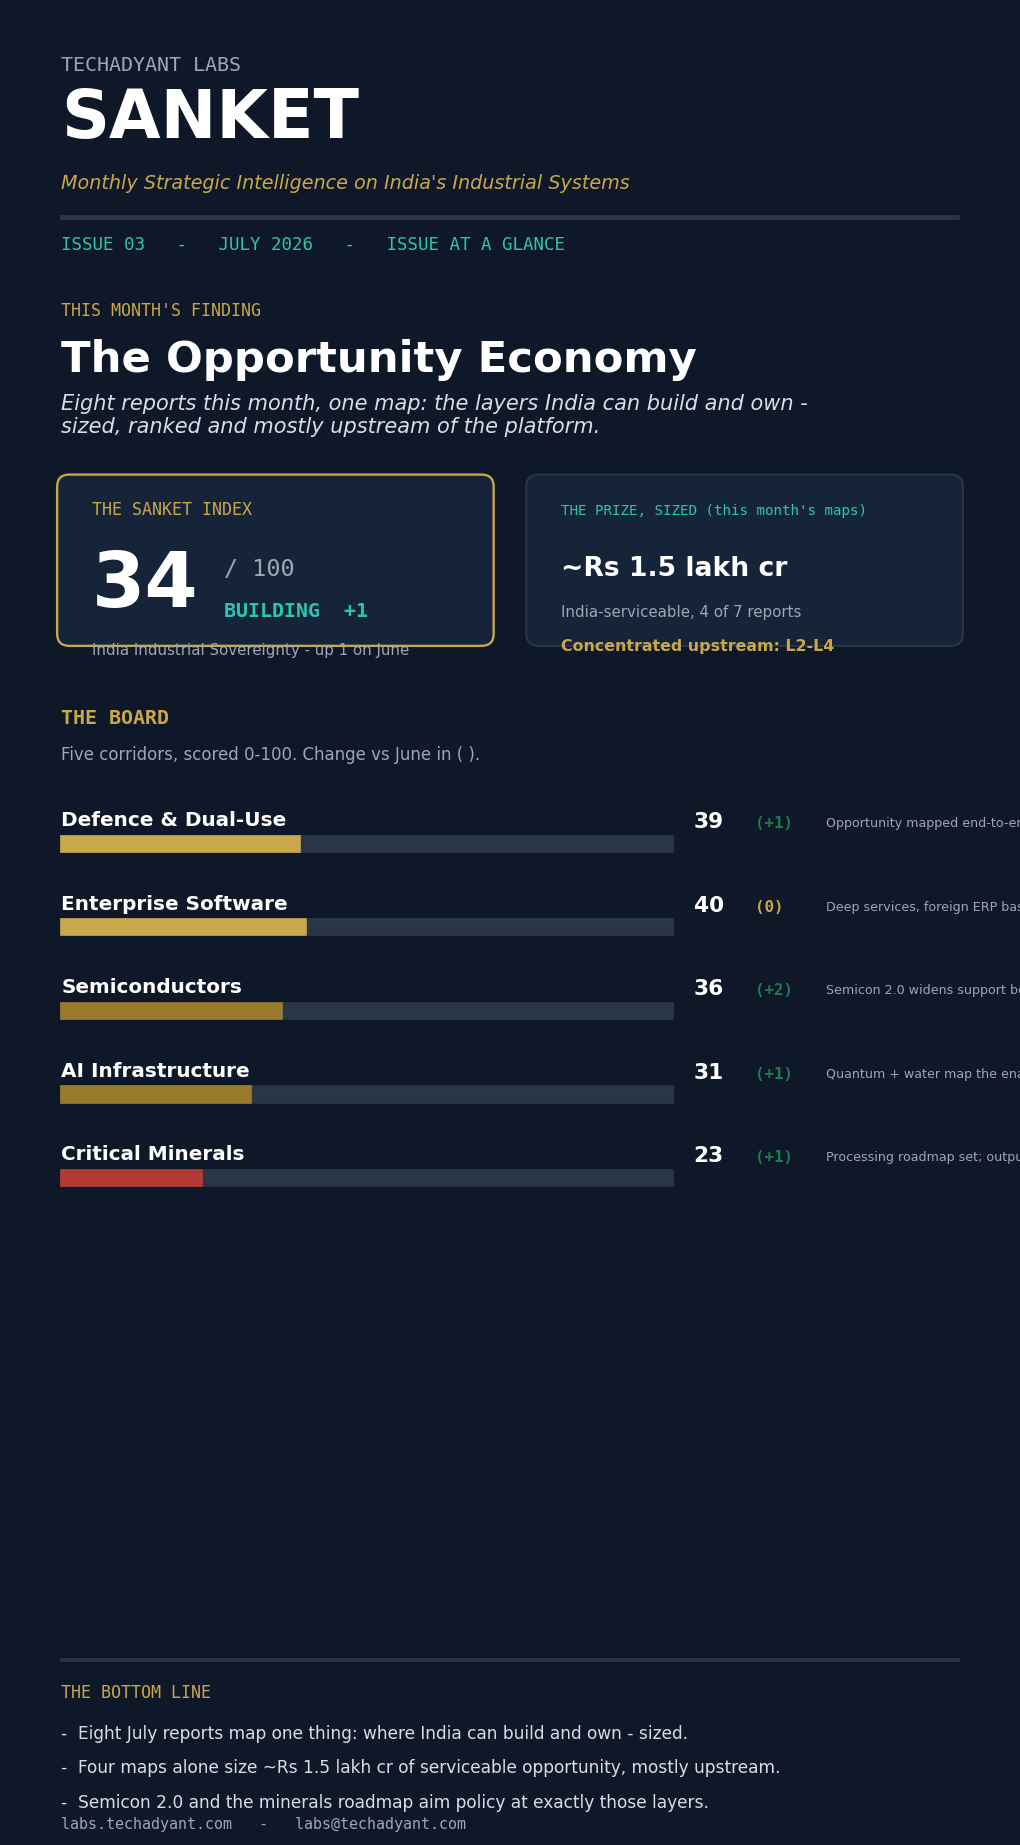
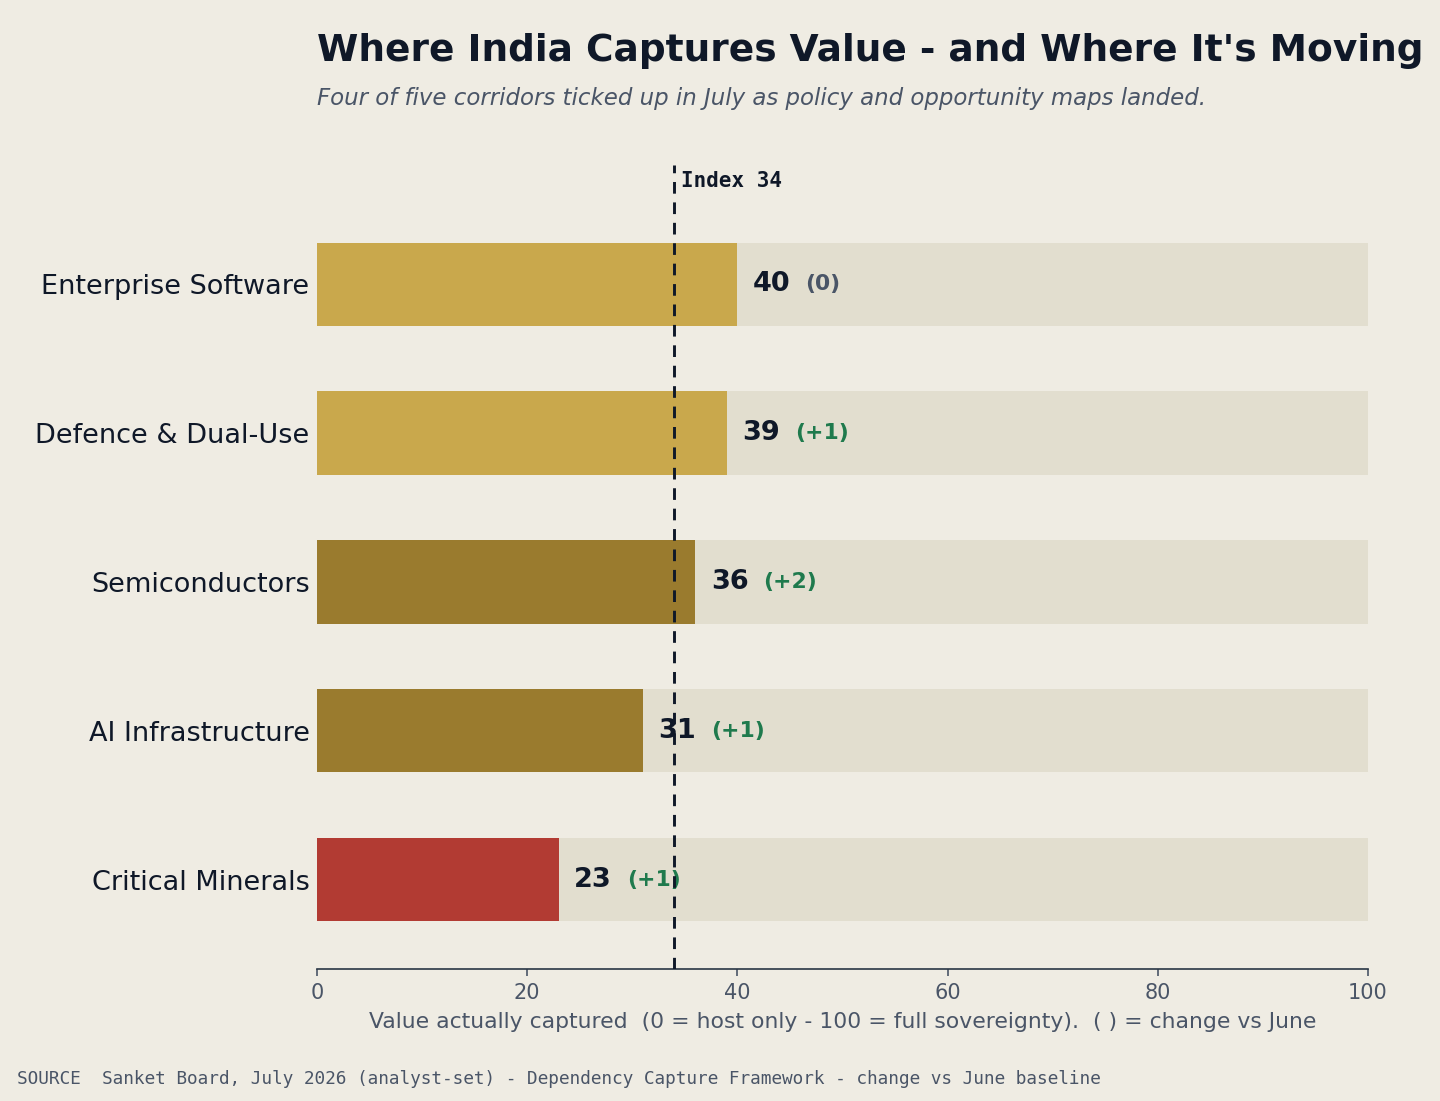
Five Corridors, Now Moving
India’s industrial sovereignty, read corridor by corridor on the Dependency Capture Framework™ — how much of the value India captures, not how much it hosts. June set the baseline; from this issue each reading carries its month-over-month move.
- Eight July reports map one thing: where India can build and own — sized, ranked and mostly upstream.
- Four maps alone size ~₹1.5 lakh crore of India-serviceable opportunity this decade — Semicon 2.0, quantum, industrial water and cargo drones.
- Semicon 2.0 confirmed the shift: ₹1.27 lakh crore now reaches machines, materials, chemicals and gases — the 65% of chip value beyond the fab.
- The critical-minerals roadmap named processing as the missing layer — China holds 60–90% of it, and India’s magnet output is still zero.
- The maps are the easy part. The test is conversion — serviceable ₹ becoming captured ₹, on an 18–30 month capacity lag.
The Opportunity Economy
June named the problem: India assembles, but the value lives upstream in the layers it does not own. July answers the obvious next question — so where, precisely, is the opportunity? Read together, this month’s eight Techadyant reports are one thing: a map of India’s opportunity economy — the specific, sized, mostly-upstream layers a founder, a fund or a ministry can actually build and own.
The maps are large and they agree with each other. Semicon 2.0 sizes ₹95,500 crore of serviceable (SOM) opportunity beyond the fab; the quantum ecosystem roughly ₹40,000 crore; industrial water about the same by 2030; civil cargo-drone demand ₹18,400 crore of fleet value by 2035. Four maps alone come to about ₹1.5 lakh crore — before counting the loitering-munition, SME-drone and critical-mineral-processing opportunities sized inside their own reports.
They cluster in the same place. Plot the eight on the Dependency Capture Framework and six of eight target Layers 2 to 4 — processing, materials and components. The opportunity economy is upstream of the visible platform, precisely where India’s capture is thinnest and its import bill highest.
Policy moved to meet it. Semicon 2.0’s second pillar, the National Critical Mineral Mission’s processing focus, the rare-earth magnet scheme — July’s policy aimed at exactly the layers the maps did. The opportunity is now named and priced. The decade’s question is no longer identification; it is conversion.
This Month’s Maps, in ₹ Crore
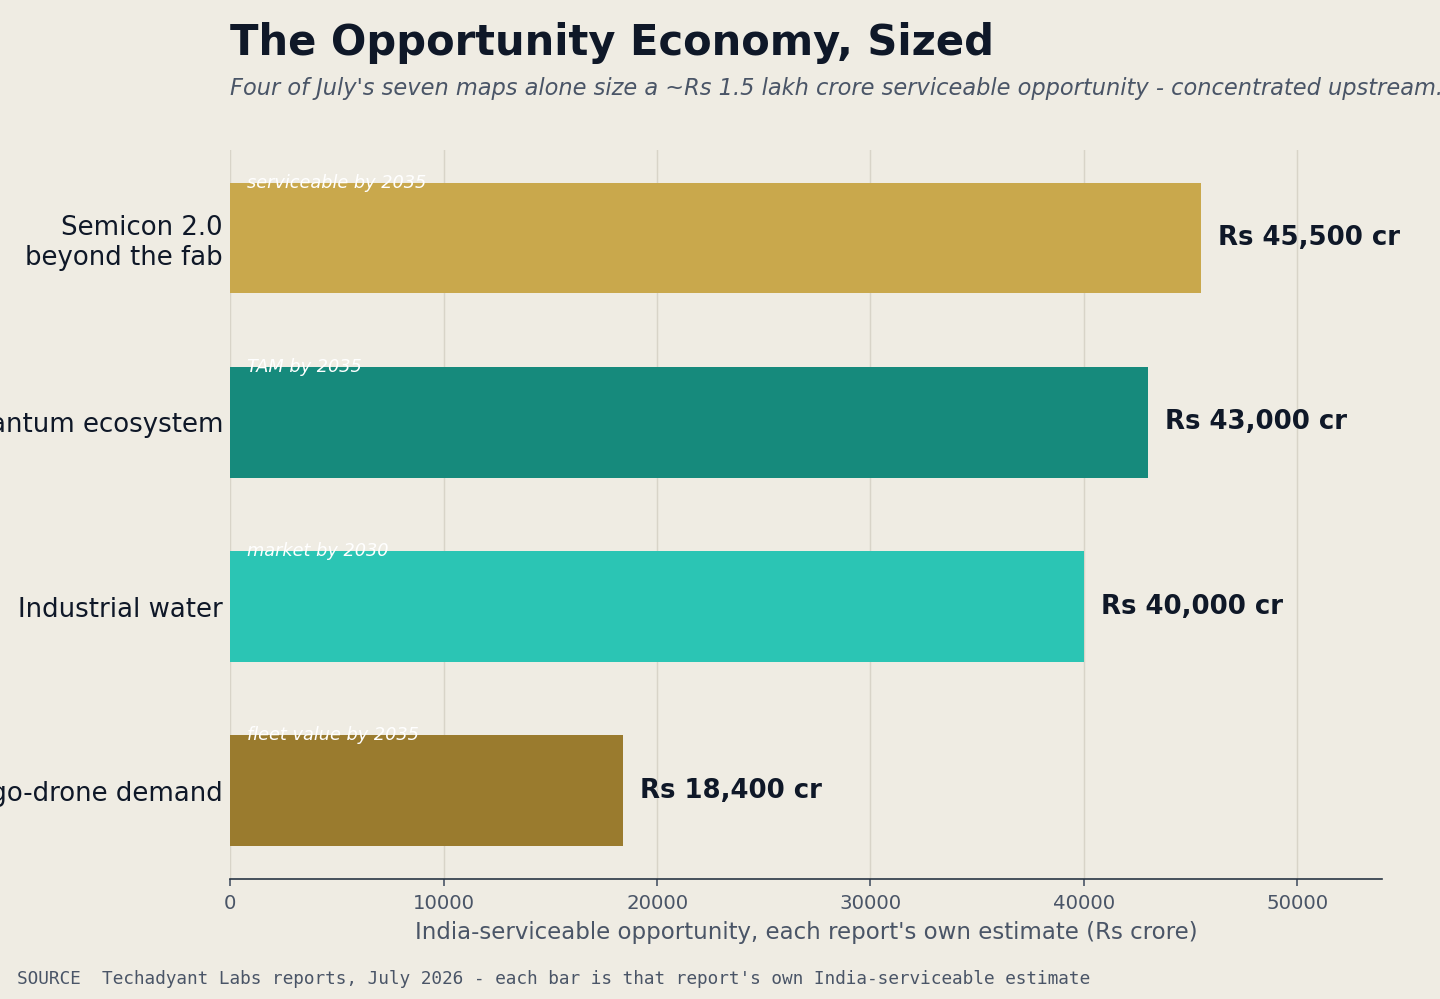
The prize is real, and it points upstream — into the processing, materials and components layers India still imports. A market-size deck is not a plant; the test is conversion.
The Prize, on One Board
This month’s maps as a dashboard, not a narrative — each opportunity sized, graded and tagged to the trigger that opened it. Every row is a candidate opportunity surface in the Atlas.
| Opportunity | Size | Confidence | Horizon | Trigger |
|---|---|---|---|---|
| Semiconductor materials & equipment | ₹95,500 cr | High | 3–5 yrs | Semicon 2.0 |
| Quantum ecosystem | ~₹40,000 cr | Medium | 5–10 yrs | National Quantum Mission |
| Industrial water & ZLD | ~₹38,600 cr | High | 3–5 yrs | Reuse / ZLD mandates |
| Cargo-drone fleet & services | ₹18,400 cr | Medium | 5–10 yrs | BVLOS corridors |
| Rare-earth magnets | Import-sub | Medium | 2–5 yrs | REPM scheme |
| Loitering-munition subsystems | Large (modelled) | Medium | 3–7 yrs | Op Sindoor demand |
| Quantum hardware & cryogenics | Import-sub | Medium | 5–10 yrs | National Quantum Mission |
| Drone SME / MRO layer | Fragmented | Medium | 0–5 yrs | Drone Rules / PLI |
Size = each report’s own India-serviceable estimate; import-sub = import-substitution play. Confidence and horizon are Techadyant assessments.
What Actually Moved in July
The month’s hard moves — capital, policy and capacity — tagged by corridor and sourced.
Semicon 2.0 Confirms the Opportunity Is Beyond the Fab
In July the Cabinet cleared Semicon 2.0 — and for the first time state support reaches the machines, materials, chemicals and gases beneath the fab. That is the whole thesis in a policy document: the fab is about 35% of the value; the other 65% — and 78% of the margin — sits in the eight upstream streams India imports. The programme is, in effect, a demand signal for exactly the SME-shaped opportunity: precision machining, cleanroom systems, specialty chemicals, metrology and packaging.
The tell to watch: whether pillar two — machines, materials, chemicals and gases — is notified with real allocations and eligibility, or stays a line in a press release.
The critical-minerals roadmap reframes mineral security as a midstream problem — refining, separation and magnets — where China holds 60–90% and India holds almost none. The opportunity, and the vulnerability, is the processing node, not the ore.
The ₹7,280 cr REPM scheme backs 6,000 MTPA of sintered-magnet capacity, with first production targeted by end-2026. India is finally funding the chokepoint, not the mine. The risk: an output gap before any line runs.
China’s licensing on gallium and germanium — where it refines 98% and 77% of world supply — sharpens the materials dependency beneath every Indian fab, and strengthens the case for a domestic high-purity base.
We assess that India spent July converting diagnosis into a map: across eight reports the opportunity economy is now sized and located — overwhelmingly in the upstream layers (L2–L4) it imports. July’s policy — Semicon 2.0, the minerals roadmap, the magnet scheme — is aimed correctly at that layer.
Principal risk: the maps outrun execution — serviceable opportunity that never becomes captured value, on the familiar 18–30 month capacity lag. A market-size deck is not a plant. Confidence is capped by India’s record on value-addition targets.
Where the Opportunity Sits
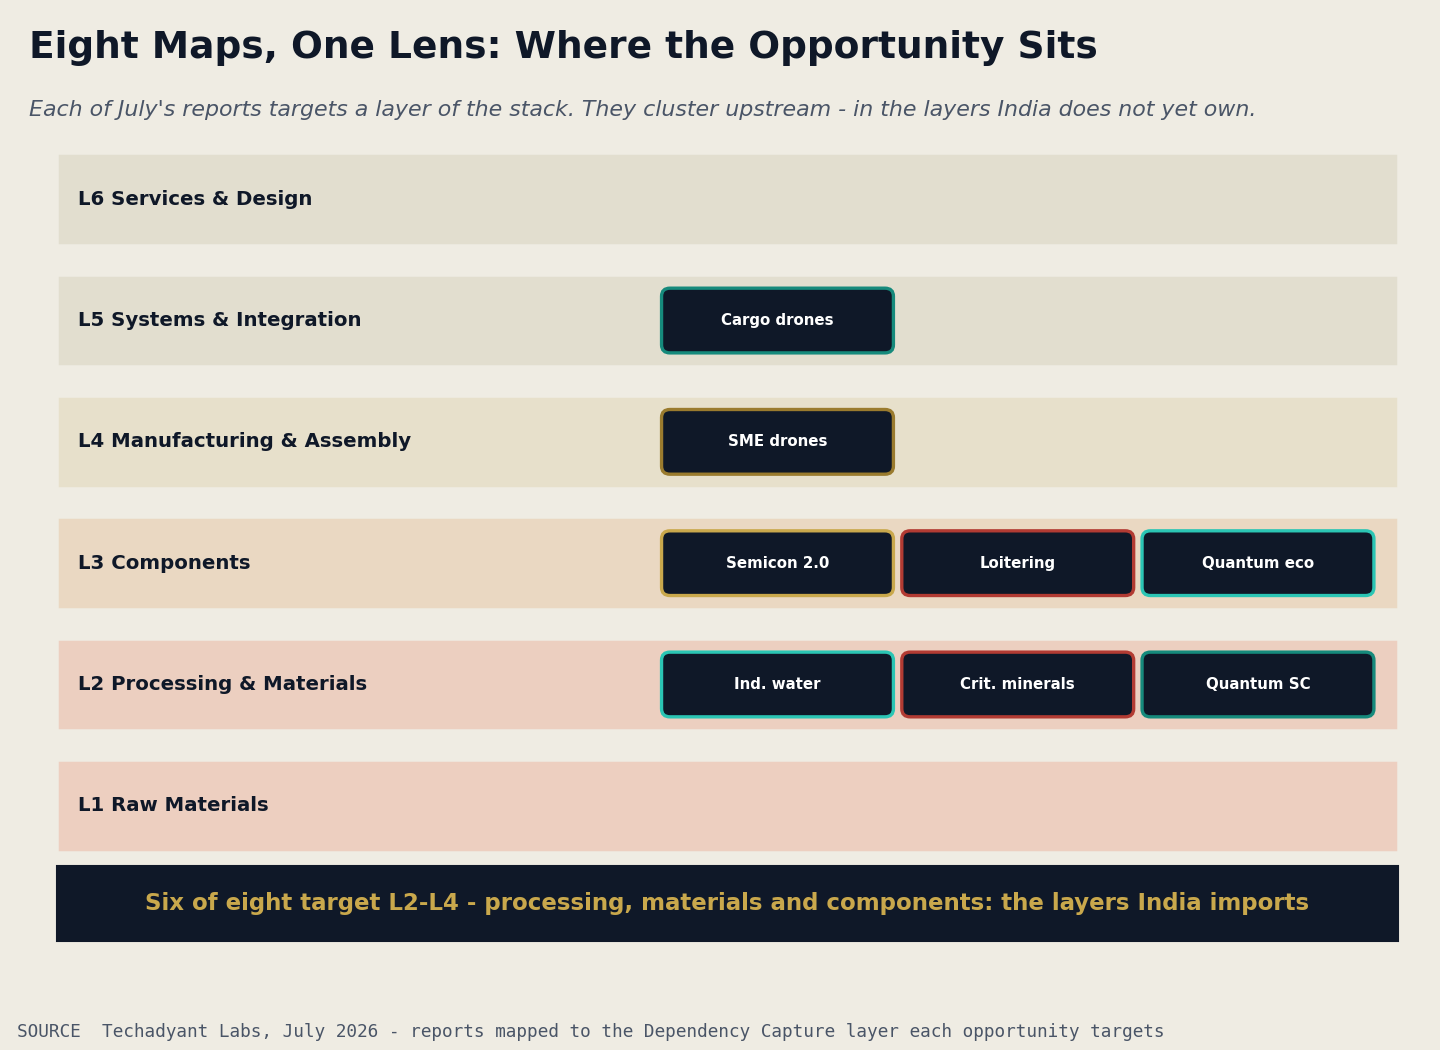
The Dependency Capture Framework™
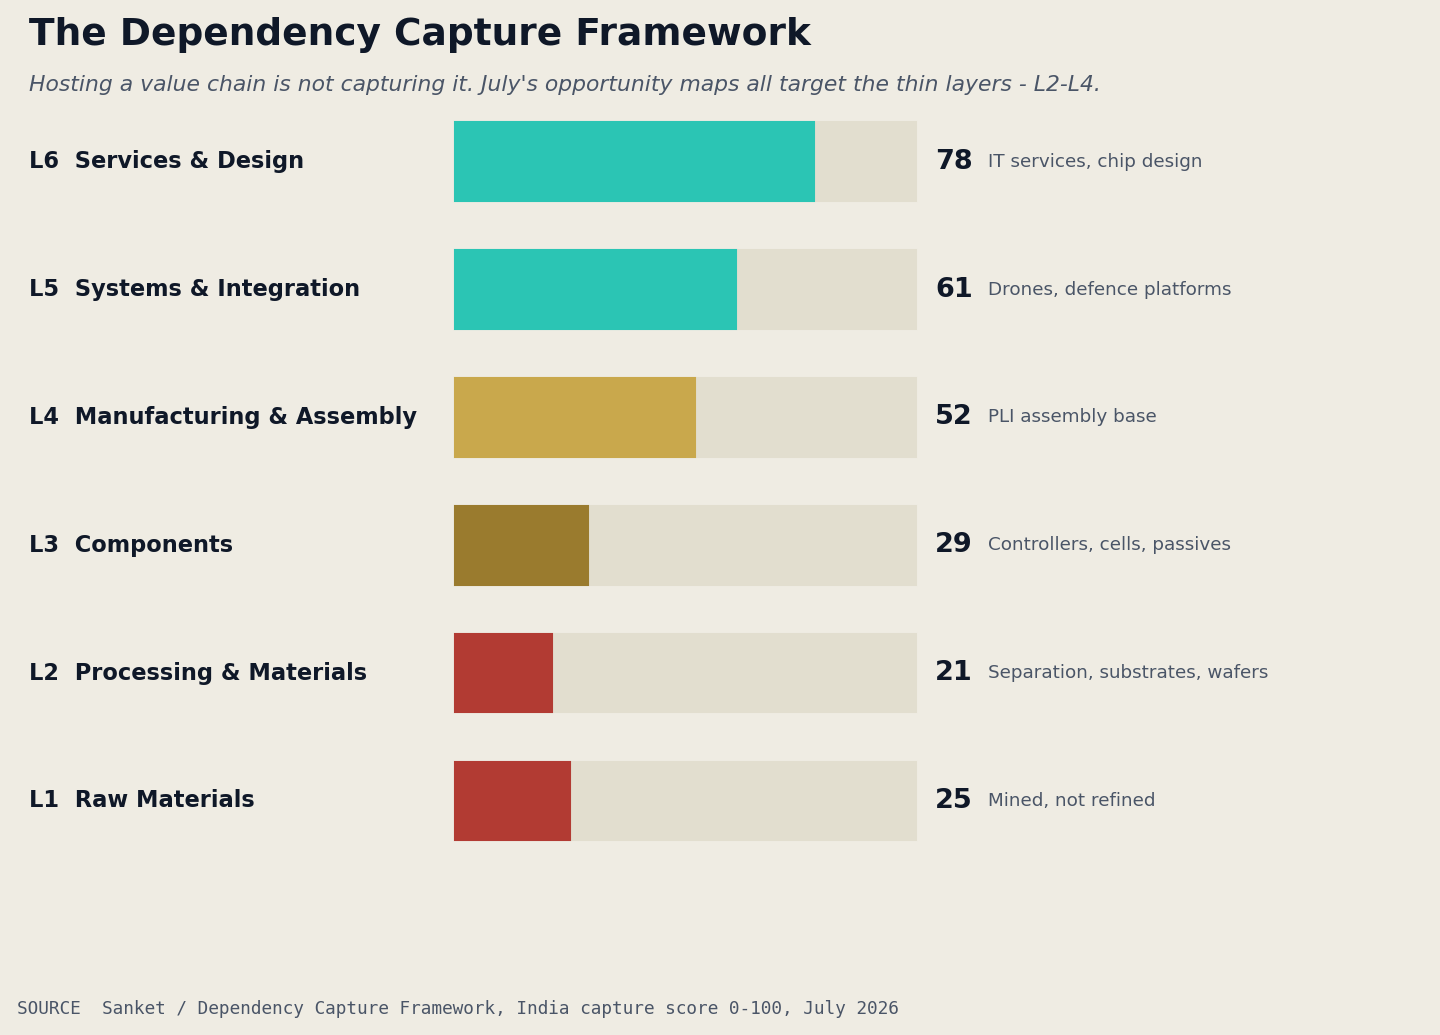
“The opportunity isn’t hidden anymore. It’s upstream — and now it’s priced.”
Rare-Earth Magnets
Sanket’s signature teardown of one capability India does not yet own — from imports to the investment it would take to close. Deposits a capability score to the Atlas: India ~5 / 100.
Eight Reports, One Lens
July’s research, each in a line and a number — the map behind this month’s thesis.
- The Semicon 2.0 Opportunity Map — the eight streams beyond the fab; ₹95,500 cr serviceable by 2035.
- Securing India’s Industrial Future — the critical-minerals processing roadmap to 2035; China holds 60–90% of processing (free).
- Beyond Quantum Computing — India’s quantum industrial ecosystem; ~₹40,000 cr TAM by 2035.
- India’s Industrial Water Opportunity Map — the market regulation is forcing into being; US$2.87bn → 4.65bn by 2030.
- India’s Cargo Drone Demand Intelligence — civil cargo-drone demand; 850 → 50,200 drones by 2035.
- India’s Loitering Munitions Market Intelligence — the loitering-munition decade and the subsystem sovereignty gap.
- The SME Playbook for India’s Drone Economy — the ₹50 lakh–5 cr opportunity layer, mapped and ranked.
- The Hidden Supply Chain of Quantum Computing — where quantum value really sits (cryogenics, control, photonics); the qubit chip is under 8% of system cost.
What’s New in the Graph
The Atlas is alive: this is what the knowledge graph gained this cycle — the permanent record every report and signal deposits.
- +269 entities, +301 relationships — the report→graph extraction pass grew the SID’s active graph by roughly two-thirds.
- Public Atlas: 116 → 246 players — a curation pass promoted the strongest new nodes into the public directory.
- Five pillar maps went live — Semiconductors, Critical Minerals, AI Infrastructure, Defence and Enterprise Software.
- Critical-minerals cluster added — NCMM, the REPM magnet scheme, IREL, Midwest and the rare-earth chain — the graph behind this month’s Capability Gap.
- Six new signals (S-017–S-022) — the critical-minerals processing cluster entered the record, each sourced and scored.
Sizing the Opportunity Is the Easy Part
Consensus will read eight opportunity maps and a ₹1.5 lakh crore number as momentum. We’d be careful. India has never lacked market-size decks; it has lacked conversion — the refineries, the magnet lines, the specialty-chemical plants that turn a serviceable number into a captured one.
A TAM is not a plant. The maps are necessary and now they exist — but the metric that matters is domestic value-add per unit and first output, not the size of the prize. Cheer the maps. Stay sceptical until the first line actually runs.
Three Ways This Plays Out
India converts one or two of these maps into real upstream capacity — a magnet line, a packaging cluster — but stays input-dependent elsewhere. Value up, ceiling visible.
The new schemes seed real supplier clusters; India crosses into chokepoint ownership in at least one corridor — magnets or advanced packaging.
The maps stay maps; incentives pool in assembly again; another sized-but-uncaptured decade — the prize named, not owned.
The open gaps in this month’s record. If you can close one, tell us.
- India’s true semiconductor-chemical (electronic-grade) capacity?
- Gallium and germanium refining capability, in tonnes?
- Rare-earth separation capacity by element?
- India’s drone fleet, by state?
Help build India’s industrial knowledge graph. We’re seeking:
- Drone MRO providers
- Accredited testing & certification labs
- Industrial-park tenant lists
- Tier-2/3 supplier directories
Contribute → [email protected]
Own the layer, not the floor space. The full July catalogue:
- Browse all reports →
- Forthcoming: India’s Critical-Minerals Processing Opportunity — where the refineries and magnet lines get built, and who captures the midstream.
- Commission bespoke research or a DPR → labs.techadyant.com/services
Every report adds evidence. Every signal updates the record. Every Atlas page expands India’s Industrial Knowledge Graph.
Get Sanket first
Monthly strategic intelligence on India’s industrial systems — independent and infrequent.