
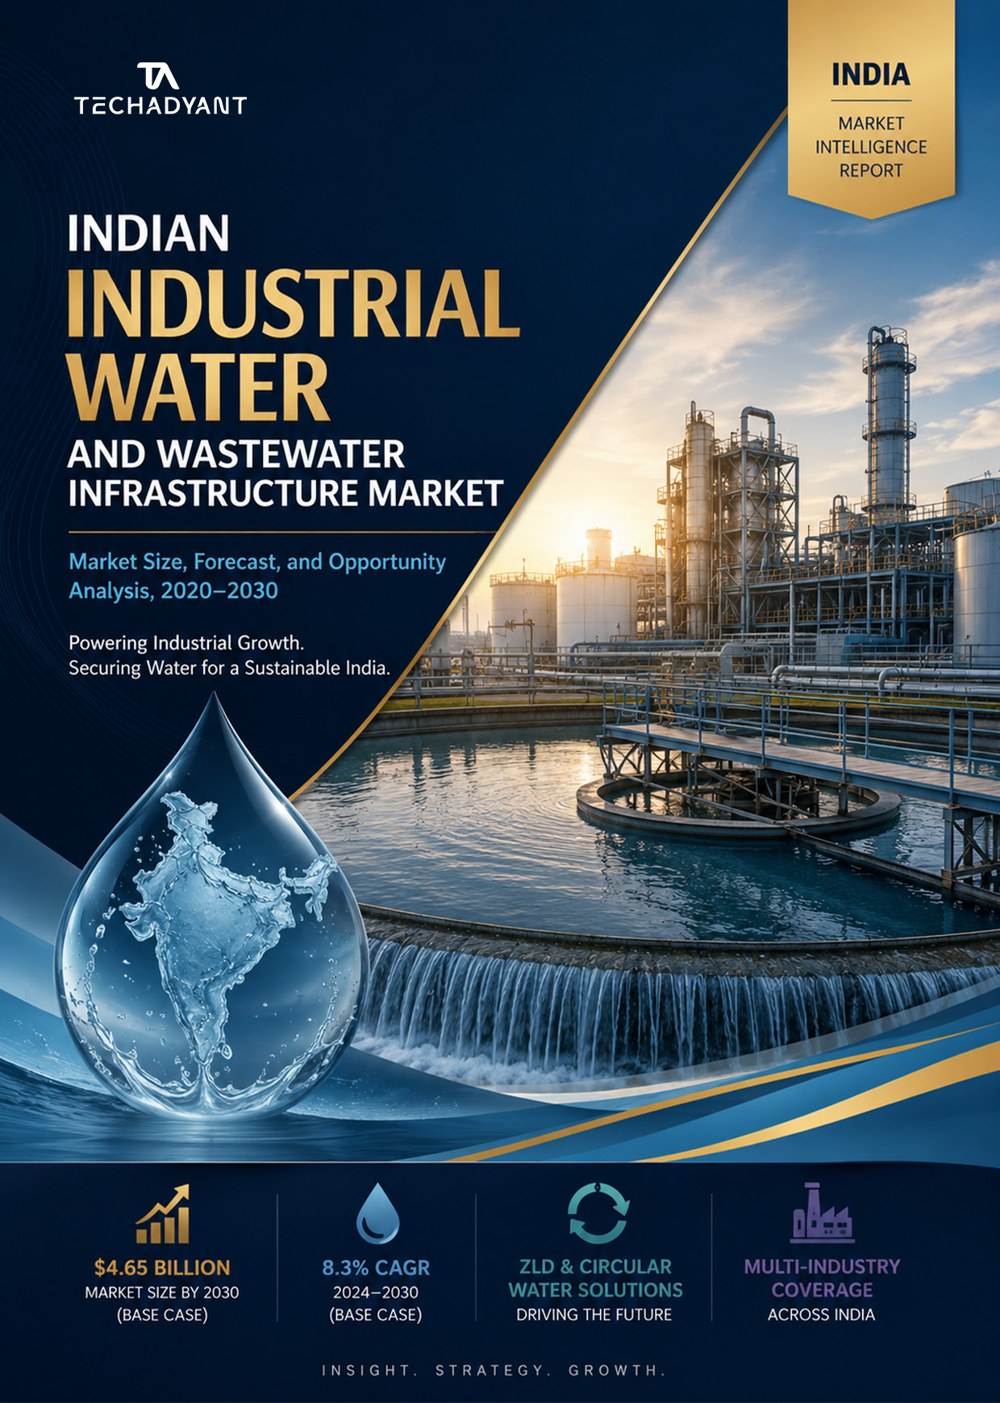
India's industrial water market is not a speculative growth story. It is a systems-adaptation story enforced by hydrological constraint and regulatory mandate — and that is precisely what makes it investable.
A market enforced, not chosen
India holds roughly 18% of the world's population against under 4% of its freshwater, and per-capita availability has fallen from 5,177 m³ in 1951 to about 1,486 m³ today (Central Water Commission; NITI Aayog). For industry, water scarcity is no longer a sustainability footnote — it is a hard bound on every expansion plan. The decisive shift of the past two years is that policy has moved from guidance to mandate, converting compliance from a cost to avoid into non-discretionary capital expenditure.
The market in numbers
The Indian industrial water and wastewater infrastructure market is estimated at USD 2.87 billion (2024), projected to reach USD 4.65 billion by 2030 — an 8.3% CAGR (Frost & Sullivan, 2025). A broader, differently-drawn market — treatment technology and equipment across the whole economy, municipal and industrial combined — runs from USD 2.73 billion (2025) to USD 4.73 billion (2031) at 9.59% (Mordor Intelligence). The two are not in conflict; they measure different boundaries.
Where the returns actually sit
Headline growth hides an uneven distribution of returns. Equipment supply and EPC are competitive, working-capital-heavy and cyclical. The margin and the durable advantage sit in the annuity and knowledge layers — operations and maintenance, specialty chemicals, and digital — and in the capability-defended frontier of semiconductor-grade ultrapure water. The investable question is not who wins the construction contract, but who holds the fifteen-year service concession and the technology behind the membrane.
The Investment Heat Map
Scoring each segment on growth, margin and entry barrier resolves the market into two winning archetypes: capability plays defended by know-how (semiconductor UPW, digital platforms), and annuity plays defended by installed base (O&M, ZLD-with-recovery). Modular and decentralised segments grow fast but compete on cost.
Regulation as the demand engine
The bankable demand through 2028 is compliance-driven. The MoEFCC Consent Guidelines 2025 (notified, effective 30 January 2025) give state boards clear authority to cancel consent to operate on non-compliance. Maharashtra's Safe Reuse and Management of Treated Wastewater Policy 2025 (notified October 2025) requires designated bulk consumers to source 20% of demand from treated wastewater by 2027–28, rising to 50% by 2031. AMRUT 2.0 adds municipal-industrial reuse offtake. The report's Policy Risk Matrix separates these notified, funded instruments — which capital can be underwritten against — from draft proposals (the CETP clearance exemption, the revised National Water Policy) that remain optionality, not base case.
Where the margin lives
A five-forces read isolates the two forces that matter most: supplier power over membranes and resins (import-dependent and concentrated) and the entry barrier in ultrapure water. Both point to the same move — secure technology and component supply through partnerships, because that is where the defensible position is won. Capability, not capital, is the binding constraint at the top of this market.
Four states, most of the market
Maharashtra, Gujarat, Tamil Nadu and Karnataka account for roughly 69% of national spend, and enforcement strength — not incentive generosity — is what turns a cluster into a project pipeline. Karnataka and Uttar Pradesh are the fastest-growing by rate, driven by semiconductor fabs and municipal-industrial reuse respectively.
Three scenarios to 2030
The market carries asymmetric risk. Water Security Revolution (9.5% CAGR, ~$4.95B) assumes full ZLD compliance by 2028 and multiple fabs online. Compliance Plateau (8.3%, $4.65B) is the base case of steady, enforcement-led adoption. Climate Shock (6.5%, ~$4.19B) models a monsoon or drought disruption compounding enforcement slippage and slower industrial CAPEX. The downside exceeds the upside — enforcement consistency is the critical variable.
What the full report adds
The full ~192-page edition carries twelve chapters, 119 tables and 46 charts: solution-tier and vertical sizing, sector deep-dives (semiconductor, pharma, chemicals, textiles, thermal power, green hydrogen, data centres), the technology landscape, verified company profiles (VA Tech Wabag, Ion Exchange, Thermax, Gradiant, CN Water), a full investment-and-financing chapter, regional opportunity mapping, and stakeholder playbooks for investors, technology providers, policymakers and industrial buyers. Every market figure is attributed to its source, and each assumption is labelled.
Unlock the complete report
You’re reading the free preview. The full analysis continues with six more sections and the downloadable PDF edition.
- 🔒04 · Water, power & land
- 🔒05 · The packaging layer
- 🔒06 · Who captures the value
- 🔒07 · The talent constraint
- 🔒08 · Second-order effects
- 🔒09 · What to watch · references
You’ll be asked to sign in, then complete a one-time secure purchase.