Home/Reports/Industrial & Deep Tech
Volume I · Flagship Edition

India’s Aerospace Supply Chain: Missing Links

Missing Links Between Components and Complete Aircraft — Why India Has the Parts but Not the Platforms, and the Industrial Architecture That Closes the Gap

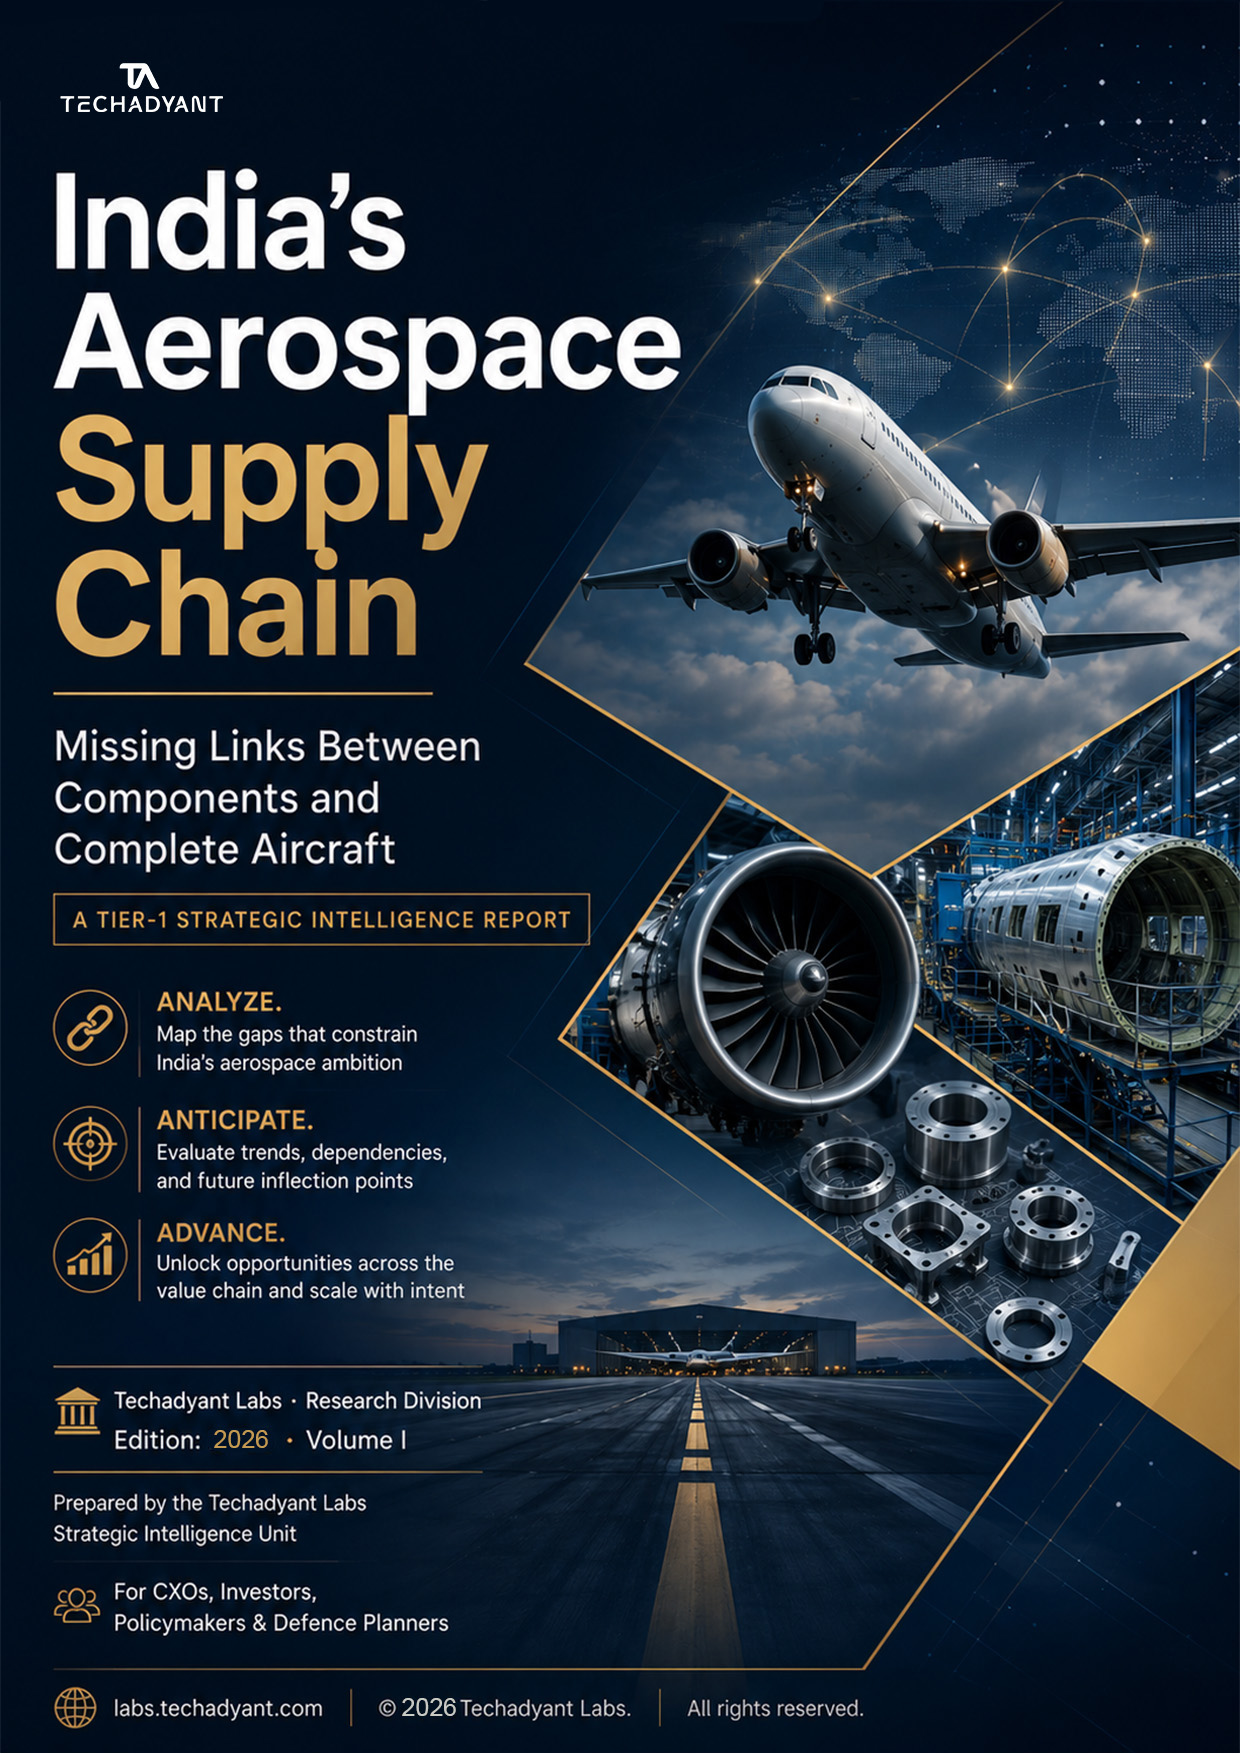
India’s Aerospace Supply Chain: Missing Links — cover
₹6,999Complete report

116-page PDF · ~ 40 min read · Figures & citations included

Checking your access…

Free condensed report · 15 pages

Free condensed edition — the thesis, the framework and the headline findings, with figures. No signup required.

Digital product — access is granted instantly and is non-refundable once downloaded. See our refund policy and terms.

What’s inside
  • Full 116-page report (PDF)
  • Proprietary analytical frameworks & scorecards
  • Primary-source citations with verification labels
  • Free condensed preview edition
  • Optional data pack — the full underlying dataset (Excel)

The Thesis

India's aerospace industry is structurally bifurcated: it has built a globally competitive Tier-2/3 component base, yet still lacks the Tier-1 sub-system integration, unified type certification, and serial final-assembly capabilities needed to produce complete aircraft. Component capability does not automatically aggregate into aircraft capability. Unless these three "missing links" are closed through coordinated institutional reform and capital reallocation inside the 2025–2027 window, India remains a ~$4.2B component-supplier economy in 2035 — forfeiting a $21B integrated-aerospace opportunity.

The strategic question is no longer whether India can make aerospace parts — it demonstrably can. It is whether the country can convert a proven component base into integrated, certified, scalable platforms. The 5× spread between the bull and bear 2035 outcomes is driven almost entirely by domestic execution on integration and certification, not by exogenous demand.

Key Numbers

$42B
Total addressable market (2025)
Techadyant Model ◆ IN-001
4.2×
Capital-formation growth, 2015–2025
Techadyant Capital Tracker
~600
Qualified Tier-2/3 suppliers today
Techadyant Supplier Directory
4.2 yrs
Average policy implementation latency
Policy Database Analysis
85%
Engine demand sourced from 3 countries
Supply-Chain Vulnerability Map
38%
Average PSU programme cost overrun
CAG Audit Reports (aggregated)

Key Findings

The capability gap is structural, not incremental.
Gap exceeds 5 points (0–10 scale) in 6 of 10 dimensions.
Chapter 4 · Capability Maturity Assessment
Type certification is the silent bottleneck.
Every indigenous platform delayed 3–7 years by certification.
Chapter 5 · The Missing Links
Capital is available but mis-allocated.
Private VC/PE is only 28% of capital vs. a 50%+ benchmark.
Chapter 7 · Investment Flows
The propulsion gap is scenario-determinative.
Civil propulsion scores 1.5/10 vs. global frontier 9.5/10.
Chapter 2 · Value Chain Deconstructed
Tier-2/3 supplier development is the universal multiplier.
Bull case scales from ~600 to 2,500 suppliers by 2032.
Chapter 5 · Industrial Dependency Matrix
MRO and UAV/eVTOL drive asymmetric returns.
Together they account for 88% of bull-case growth.
Chapter 3 · Market Sizing & Forecasts

The Framework

The Situation–Complication–Resolution architecture. Techadyant Labs evaluates industrial ecosystems through a tripartite lens. The Situation maps the current baseline of capital, policy and capability. The Complication identifies the structural bottlenecks — the "missing links" — that prevent baseline inputs from compounding into systemic output. The Resolution prescribes coordinated, parallel interventions across institutional architecture, capital allocation and technology readiness to close the gap within a defined time horizon.

What It Means

For policymakers

Incremental policy adjustments will not close the gap; structural institutional reform is required — specifically a unified National Aerospace Certification Authority (NACA), a $1.5B Aerospace Tier-2/3 Supplier Development Fund, and an aerospace-specific SEZ regime with extended tax holidays. Execution within the 2025–2027 window is the decisive variable for the 2035 outcome.

For industry (PSUs & private sector)

The existing public-sector architecture cannot deliver the 2035 vision alone. PSUs must re-architect via joint ventures and selective divestment, shifting from monopoly integrators to anchor customers. For the private sector, the highest-value opportunity is not replicating the OEM model but occupying the Tier-1 sub-system integrator layer in avionics, landing gear and composite structures.

For investors

The India aerospace opportunity is real, large and under-capitalised — but the horizon is 7–12 years, not 3–5. Patient capital across five priority surfaces (MRO hub build-out, UAV/drone champions, Tier-2/3 supplier funding, certification-authority build, aerospace workforce) can generate 3–5× returns, with option value in propulsion and eVTOL breakouts offering further upside.

Analytical Figures

The divergence in India's aerospace trajectory is fundamentally a function of market-capture efficiency. While the Total Addressable Market grows steadily, the Serviceable Obtainable Market — the revenue Indian industry can realistically capture — shows a 5× spread between the bear and bull scenarios. That spread is not driven by exogenous shocks, but by domestic execution on integration and certification.

$0B $5B $10B $15B $20B+ $4.0B 2025 Actual $4.2B 2035 Bear $11.7B 2035 Base $21.0B 2035 Bull
Figure 1 · Serviceable Obtainable Market (SOM) scenarios, 2025–2035. Source: Techadyant Labs Market Model.

The root cause of the SOM divergence lies in sub-system capability maturity. India shows functional competence in airframe structures and testing, but critical deficits in high-control-point sub-systems. The capability-gap matrix below quantifies the disparity against the global frontier (USA, France, UK, Germany, Japan): propulsion and avionics are the deepest structural voids.

Propulsion Avionics Landing Gear Final Assembly 2.2 / 9.7 3.0 / 9.5 3.5 / 9.0 3.5 / 9.0 India capability Global frontier
Figure 2 · Capability-gap matrix (0–10 scale) for critical sub-systems. Source: Techadyant Labs Capability Assessment Framework.

Closing these gaps requires a fundamental re-allocation of capital. Historically, capital formation has been dominated by government spending and concentrated in Tier-2/3 capacity expansion. The bull case inverts this ratio — directing private capital toward Tier-1 integrator build-outs and institutional enablers — lifting total annual capital formation from $4.7B to $13.0B by 2030.

2025 Actual $4.7B 2030 Bull Target $13.0B VC / PE FDI Government Public Markets
Figure 3 · Capital-formation composition by source, 2025 vs. 2030 bull target. Source: Techadyant Labs Capital Tracker.

The Numbers, Tabulated

Three-scenario outcome comparison (2035)

VariableBull caseBase caseBear case
Industry revenue$21.0B$11.7B$4.2B
Capability maturity (avg score)3.8 / 5.03.0 / 5.02.7 / 5.0
Qualified Tier-2/3 suppliers2,5001,500800
Aerospace exports$5.0B (24% share)$2.5B (16% share)$0.7B (8% share)

Top-priority strategic recommendations

StakeholderRecommendationHorizonCapital
Government of IndiaEstablish National Aerospace Certification Authority (NACA)12–18 months$300M (5-yr build-out)
Government of IndiaLaunch $1.5B Aerospace Tier-2/3 Supplier Development Fund12 months$1.5B (10-yr fund)
Public-sector OEMsForm 3 strategic propulsion JVs with foreign OEMs24 months$2.4B (combined)
Indian private Tier-1Build 5 designated Tier-1 sub-system integrator entities36 months$3.5B (combined)

What to Watch

  • Q4 2026Operationalisation of the proposed $1.5B Aerospace Tier-2/3 Supplier Development Fund and notification of the aerospace-specific SEZ regime.
  • Q4 2027Statutory establishment and initial operational capability of the National Aerospace Certification Authority (NACA).
  • 2030Target operational status of the indigenous AMCA engine and the first two commercial-aircraft Final Assembly Lines (FALs).
  • 2032Milestone for scaling the qualified Tier-2/3 supplier base to 2,500 entities and launching a credible civil 70-seater engine programme.

Frequently Asked Questions

What is the projected size of India's aerospace market by 2035?
India's aerospace Serviceable Obtainable Market (SOM) is projected to reach $21.0 billion in the bull case, $11.7 billion in the base case, or $4.2 billion in the bear case by 2035. This 5× spread is dependent almost entirely on domestic policy execution and capital allocation, not on exogenous market size.
Why can't India produce complete aircraft despite having a component base?
India lacks three structural "missing links": Tier-1 sub-system integration capability, a unified type certification authority, and serial final-assembly lines. Component manufacturing capability does not automatically aggregate into complete-aircraft capability without these integrating institutions.
What is the average policy implementation latency in India's aerospace sector?
Implementation latency averages 4.2 years from policy notification to first procurement impact, based on Techadyant Labs' analysis of twelve major policy actions between 2001 and 2025. This latency is the principal execution challenge.
How much capital is required to achieve the bull-case scenario?
The eight top-priority recommendations require approximately $16.7 billion (₹1.39 lakh crore) of capital deployment over 36 to 60 months. This unlocks the bull-case outcome of additional annual aerospace revenue by 2035.
What is the current capability gap in aerospace propulsion?
Civil propulsion scores 1.5 out of 10 for India compared to 9.5 for the global frontier — an 8.0-point gap. Geared-turbofan technology shows a similar 8.0-point gap, making it the single deepest capability deficit in the value chain.

Sources & Methodology

This reading edition is derived from the full Tier-1 Strategic Intelligence Report. Primary methodology includes:

  1. 42 structured expert interviews (PSU executives, private founders, foreign-OEM country managers, MoD/MoCA officials, VC/PE partners, and academic faculty).
  2. Triangulated market sizing using Union Budget documents, MoD/MoCA Annual Reports, DPIIT FDI statistics, and SIDM/CAPA industry forecasts.
  3. Proprietary Techadyant Labs Capability Assessment Framework (10-dimension, 5-point maturity scale) calibrated against global-frontier benchmarks.
  4. 27-variable scenario modelling across policy execution, capital formation, capability milestones, supplier base, and export competitiveness.

Evidence labels — [V] verified · [V1] single-source · [U] unverified · [modelled] analytical projection. Figures are indicative of the full report's models; see the complete edition for source lines and assumptions.

Continue reading

Unlock the complete report

You’re reading the free preview. The full analysis continues with six more sections and the downloadable PDF edition.

  • 🔒04 · Water, power & land
  • 🔒05 · The packaging layer
  • 🔒06 · Who captures the value
  • 🔒07 · The talent constraint
  • 🔒08 · Second-order effects
  • 🔒09 · What to watch · references

You’ll be asked to sign in, then complete a one-time secure purchase.

Did this research answer your question?

Want us to go deeper on this — or research something adjacent? Shape what we research next →

Primary sources

Frequently asked questions

What is the projected size of India’s aerospace market by 2035?
India’s aerospace Serviceable Obtainable Market (SOM) is projected to reach $21.0 billion in the bull case, $11.7 billion in the base case, or $4.2 billion in the bear case by 2035 — a 5× spread that is dependent almost entirely on domestic policy execution and capital allocation, not on exogenous market size.
Why can’t India produce complete aircraft despite having a component base?
India lacks three structural "missing links": Tier-1 sub-system integration capability, a unified type certification authority, and serial final-assembly lines. Component manufacturing capability does not automatically aggregate into complete-aircraft capability without these integrating institutions.
What is the average policy implementation latency in India’s aerospace sector?
Implementation latency averages 4.2 years from policy notification to first procurement impact, based on Techadyant Labs’ analysis of twelve major policy actions between 2001 and 2025 — the principal execution challenge for the 2035 outlook.
How much capital is required to achieve the bull-case scenario?
The eight top-priority recommendations require approximately $16.7 billion (₹1.39 lakh crore) of coordinated capital deployment over 36 to 60 months, spanning a certification authority, a Tier-2/3 supplier fund, propulsion JVs and five domestic Tier-1 integrator entities.
What is the current capability gap in aerospace propulsion?
Civil propulsion scores 1.5 out of 10 for India compared to 9.5 for the global frontier — an 8.0-point gap. Geared-turbofan technology shows a similar 8.0-point gap, making it the single deepest capability deficit in the value chain.
Evidence labels[V] verified · [V1] single-source · [U] unverified · [modelled] analytical projection
Share this
Keep reading

Related research

Read the next edition first

New reports, signals and briefings on India’s industrial systems — infrequent and independent.

Subscribe