
The Thesis
India's EW/SIGINT industrial base has reached a strategic inflection point. The post-Sindoor procurement wave — over ₹70,000 crore committed to EW line items in twelve months — has unlocked demand; the binding constraints are now GaN MMIC capacity, cognitive-EW software and procurement-cycle velocity. Under the Strategic Breakout scenario the market expands from ₹3,200 crore (FY24) to ₹22,000 crore (FY35), but the modal outcome without structural reform remains Stagnant Continuity at a 55% probability.
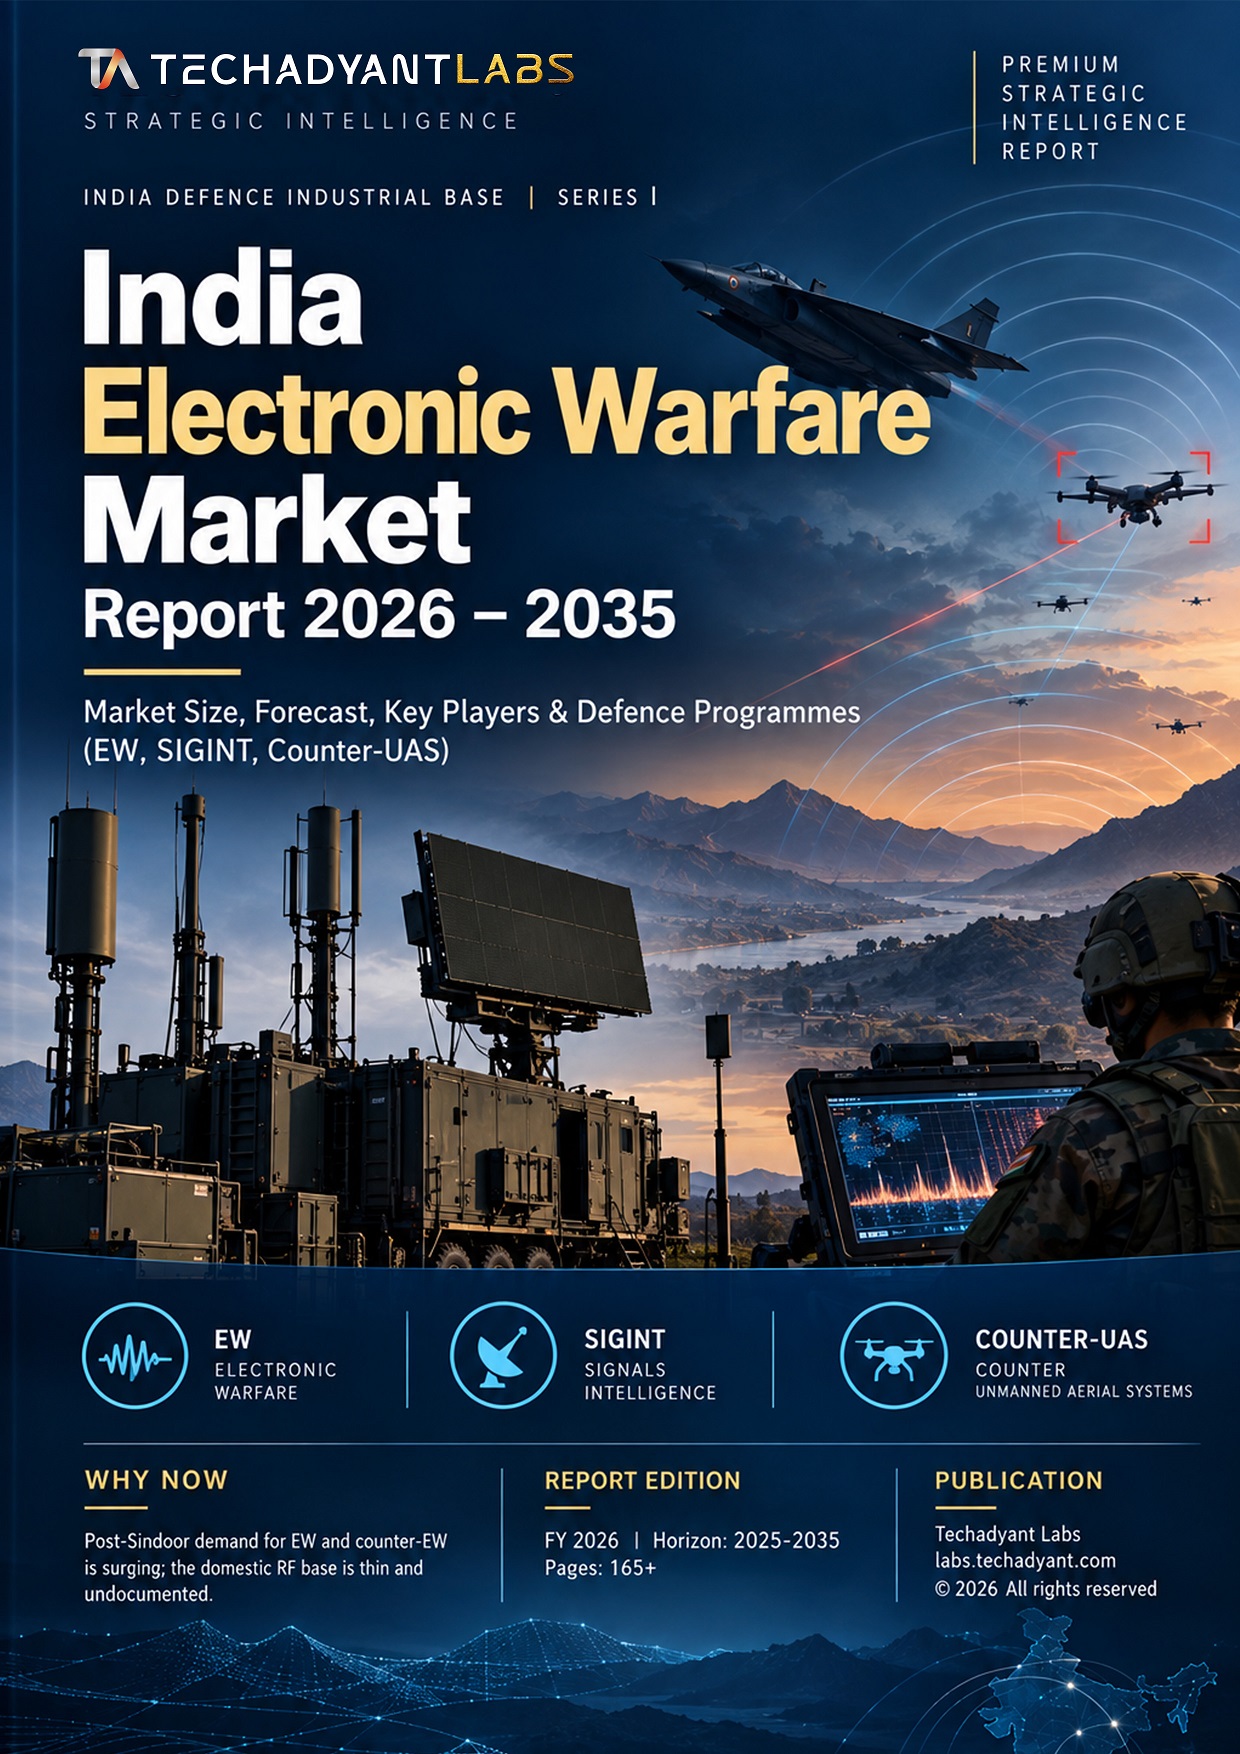
This report is the first systematic, sub-component-level strategic intelligence publication on India's EW and SIGINT industrial base. It maps where the domestic RF base actually stands — below the platform level, at the component, subsystem and material layer — and answers four questions: what the base looks like, where the strategic gaps sit, how the Sino-Pak threat shapes the investment thesis, and what each stakeholder should do over the next decade.
Key Numbers
Key Findings
The demand side is locked in. DAC approvals since Sindoor commit ₹70,000+ Cr to EW — the largest EW investment cycle in Indian defence history.
MoD AoN disclosures, BEL order pipeline ◆ IN-001BEL is the structural winner. Its EW order book expands from ₹3,200 Cr (FY22) to a projected ₹26,500 Cr (FY30), lifting EW from 6% to 26% of total order book.
BEL annual reports FY22–FY26 ◆ IN-009The deepest chokepoint is upstream. SiC substrate is 95% imported, MOCVD reactors 100%, specialty gases 95%, BAW/SAW filters 90%.
RF import dependency matrix ◆ IN-004Design sovereignty is achieved; production sovereignty is not. SSPL/GAETEC cleared GaN HEMT tests, placing India among ~7 nations — but fab throughput sits near 100 wafers/month.
DRDO disclosures ◆ IN-010Cognitive EW is the decade-defining gap. Indian programmes are at TRL 4–5; the PLA's Information Support Force operates at TRL 6–7. The gap could become decisive by 2028–2030.
IISS Military Balance 2025, CSIS ◆ IN-006Capital allocation is inverted. Of ~₹41,000 Cr annual EW-relevant flow, only ~6% reaches startups — against a venture-grade need of ₹500+ Cr/yr.
Capital-flow model ◆ IN-011Space SIGINT is the highest-leverage vulnerability. India fields EMISAT (1 satellite, intermittent); China operates Yaogan-30 (near-continuous). Gap assessed at 5–7 years.
ISRO / CSIS China Power Project ◆ IN-012Exports are policy-bound, not capability-bound. No confirmed Indian EW line-item export exists; SCOMET/Wassenaar alignment delays licensing to 12–18 months vs a recommended 60–90 days.
DGFT notifications, MoD export data ◆ IN-013The Framework
The analysis rests on two proprietary instruments. First, a four-horizon roadmap — Horizon 1 (2025–27), Horizon 2 (2028–30), Horizon 3 (2031–35) and Stretch (2035+) — in which each horizon's outcomes are gating conditions for the next; sequencing is treated as non-negotiable because partial delivery does not yield partial strategic benefit.
Three-scenario envelope. Every forward-looking figure is expressed across three conditional cases rather than a single forecast: Stagnant Continuity (55% probability, ₹9,200 Cr market, import dependence persists), Constrained Acceleration (28%, ₹15,000 Cr, MMIC 35% indigenous, exports begin), and Strategic Breakout (17%, ₹22,000 Cr, 80%+ MMIC sovereignty, cognitive EW operational, ₹6,000 Cr annual exports). Probabilities are analytical estimates per Shell scenario methodology, not statistical derivations.
A second instrument — the capability-gap matrix — scores each segment on strategic need (0–10) against indigenous capability (0–10), isolating six critical gaps where need exceeds 8 and capability falls below 4: GaN MMIC fab, BAW/SAW filters, cognitive EW, space SIGINT, cyber-EW convergence and RF test equipment.
What It Means
For Policymakers
Procurement velocity — not budget — is the binding constraint. The ₹70,000+ Cr already committed is sufficient to close the capability gap by 2030 only if the 9.5-year cycle compresses toward the ~4.0-year peer average. A dedicated EW procurement velocity cell within the DAC, with delegated authority to clear sub-₹500 Cr urgent procurements in 90 days, is the single highest-leverage structural reform available.
For Industry
The EW market of 2030 will differ materially from 2024. Software-defined EW (Pragyashakti) shifts value capture from hardware to algorithms; cognitive EW shifts it from pre-programmed threat libraries to adaptive learning systems. Vendors winning the Pragyashakti integrator role capture disproportionate economic rent; purely hardware-dependent vendors face margin compression as MMIC capacity commoditises.
For Investors
The alpha lies in three segments, not the broad market: GaN MMIC design and fabrication, cognitive-EW software, and counter-UAS RF. Listed plays (BEL, Astra Microwave, Data Patterns, Paras Defence) capture the prime layer; venture plays (Aelius, AGNIT, Polymatech) capture the component layer. Tiered entry is advised — Tier 1 in 2026–27, Tier 2 in 2027–28, Tier 3 in 2028–30.
Analytical Figures
The following exhibits distil the report's core quantitative arguments. Each is drawn directly from the source document's models and benchmarks; underlying data tables appear in the full report's appendices and Excel workbook.
The most consequential number in the report is the spread between scenarios. The committed-programme baseline — built bottom-up from DAC/AoN disclosures, the BEL/DRDO order pipeline and approved EW line items — anchors FY24 at ₹3,200 crore. From there, the trajectory forks sharply depending on execution. The chart below plots all three paths to FY35 alongside the committed baseline, making the cost of drift visually explicit: the distance between the Stagnant floor (₹9,200 Cr) and the Breakout ceiling (₹22,000 Cr) is itself larger than the entire present market.
Figure 1 · India EW Market Trajectory — Committed Baseline vs Three Scenarios (₹ Cr)
Read carefully, the grey dashed line is the default. It assumes nothing breaks but nothing accelerates either — procurement cycles stay near 9.5 years, MMIC indigenisation stalls below 20%, and private primes never reach tier-1 status. The amber line requires four catalysts firing together: full GaN MMIC sovereignty, cognitive EW operational across three services by 2032, a space-EW constellation, and Quad SIGINT tactical integration. The report's recommendations are explicitly designed to shift probability mass upward along this fan.
If the scenario fan defines the prize, the import-dependency chart defines the obstacle. India's RF component base is strongest exactly where it matters least (module assembly, ~45% imported) and weakest where it matters most (substrate, epitaxy equipment, gases, filters, test gear — all 90–100% imported). The horizontal bars below rank twelve segments by FY26 import share; the six shaded red exceed the 75% threshold that, combined with a strategic-need score above 8/10, marks them as critical gaps.
Figure 2 · RF Component Import Dependency by Segment (FY26)
The structural lesson is that India has built a top-heavy industrial base — strong at system integration (~85% value captured domestically) and module assembly, but thin at the foundational layers. Closing this is not a matter of building one more fab; it requires a vertically integrated RF semiconductor ecosystem spanning substrate, epitaxy, MMIC, module and system simultaneously.
The capability-gap matrix converts those two dimensions into a decision grid. Horizontal axis is indigenous capability (0–10); vertical axis is strategic need (0–10). Points sitting high and left — high need, low capability — are the binding constraints. Six clusters occupy that quadrant: GaN MMIC fab, BAW/SAW filters, cognitive EW, space SIGINT, cyber-EW convergence and RF test equipment. Their bubble size encodes FY35 addressable market, so the eye is drawn to where money and urgency coincide.
Figure 3 · Capability Gap Matrix — Need vs Indigenous Capability (bubble = FY35 market)
The practical implication for capital allocators: the red cluster is precisely where pure commercial logic fails, because these are the smallest-addressable-market segments with the longest payback. That is why the report recommends a government-anchored ₹3,000 Cr GaN MMIC production-isation fund and a ₹500 Cr RF Component Venture Fund — instruments calibrated to the failure mode of unfettered markets in deep-tech sovereign supply chains.
Across every finding runs a single meta-constraint: time. India's Acceptance-of-Necessity-to-first-delivery cycle averages 9.5 years — 2.4× the peer-country mean of roughly 4.0 years. The bar chart below places India against five comparators. The amber target line marks the report's recommended compression to 5–6 years by 2028, achievable only through the proposed EW procurement velocity cell.
Figure 4 · Defence Procurement Cycle Time — India vs Peers (years)
Because the post-Sindoor wave commits capability deliveries across 2028–2032 under current timelines, the cycle-time variable effectively sets the deadline for the entire strategy. If India cannot field cognitive EW before the PLA reaches TRL 9 around 2030, the technological advantage accrued through procurement simply arrives too late to deter. This is the sense in which the window — open today thanks to aligned political will, budget and threat perception — closes by 2030.
Finally, the capital-flow diagram reconciles ambition with reality. Of approximately ₹41,000 crore in annual EW/SIGINT-relevant flows — MoD capital budget (₹22,000 Cr), DRDO R&D (₹12,000 Cr), BEL capex (₹4,000 Cr) and VC/PE (₹3,000 Cr) — roughly 70% lands with listed primes, 20% with conglomerate primes, just 6% with startups, and 4% with foreign JVs. Yet the startup layer holds the highest-leverage MMIC and cognitive-EW gap.
Figure 5 · Capital Flow — Where EW Money Actually Goes (FY26 est., ₹ Cr)
This inversion is the report's quiet indictment. India has solved the demand problem decisively; it has not solved the allocation problem. Until the venture-grade RF component layer is funded at scale — whether through the recommended MoD–MeitY ₹500 Cr fund or expanded iDEX tickets — the deepest chokepoints in Figure 2 will persist regardless of how many rupees the DAC approves upstream.
The Numbers, Tabulated
Table 1 · Three Scenarios to FY35
| Metric | Stagnant Continuity (55%) | Constrained Accel. (28%) | Strategic Breakout (17%) |
|---|---|---|---|
| FY35 market | ₹9,200 Cr | ₹15,000 Cr | ₹22,000 Cr |
| MMIC indigenous | <20% | 35% | 80%+ |
| Cognitive EW | TRL 4–5 lag | TRL 7 partial | TRL 9 operational |
| Space SIGINT | EMISAT only | Limited | 6–8 sat persistent |
| Procurement cycle | 8–9 yrs | 6–7 yrs | 4–5 yrs |
| EW exports / yr | Minimal | ₹2,000 Cr | ₹6,000 Cr |
| Sino-Pak deterrence | Not deterred | Partial | Credible |
Table 2 · Critical RF Chokepoints (FY26 import share)
| Segment | Import share | FY35 indigenous target | Risk |
|---|---|---|---|
| RF test equipment | 100% | 20% | Critical |
| Specialty gases (Ga precursors) | 95% | 40% | Critical |
| SiC substrate | 95% | — | Critical |
| MOCVD reactors | 100% | — | Critical |
| BAW/SAW filters | 90% | 30% | Critical |
| RFIC transceivers | 85% | 45% | Critical |
| GaN MMICs (HEMT) | 75% | 50% | Critical |
| T/R modules (assembled) | 45% | 75% | Manageable |
Table 3 · Top Investment Opportunities by Tier
| Tier | Segment | Entry window | 5-yr return | Vehicles |
|---|---|---|---|---|
| Tier 1 | GaN MMIC design & fab | 2026–27 | 3–5× | Astra/AMPL, Aelius, AGNIT, Polymatech |
| Tier 1 | Cognitive EW software | 2026–27 | 3–5× | BEL, Data Patterns |
| Tier 2 | BAW/SAW filters (greenfield) | 2027–28 | 5–10× | No current Indian player |
| Tier 2 | RF test equipment (greenfield) | 2027–28 | 5–10× | No current Indian player |
| Tier 3 | Counter-UAS RF scale-up | 2028–30 | 2–3× | BEL, Paras Defence, Solar Ind. |
| Tier 3 | System integration | 2028–30 | 2–3× | BEL, Tata Adv., L&T Defence |
Full risk-adjusted-return derivation, weighted-average-cost-of-capital assumptions and comparable-company multiples appear in Chapter 10 and the accompanying Excel workbook.
What to Watch
- 2027Pragyashakti v1.0 fielding. The 25-month clock from the 30 Oct 2025 launch implies first operational capability in late 2027 / early 2028 — the foundation for cross-service EW software interoperability and the trigger for a structural re-rating of BEL and Data Patterns.
- 2027GaN fab threshold. SSPL/GAETEC throughput must reach 1,000 wafers/month (from ~100) — the level at which domestic MMIC output can meet Uttam (980+ T/R modules) and Virupaksha (2,400+ T/R modules) AESA demand alone.
- 2028–29Commercial GaN fab operationalisation. Polymatech (₹1,143 Cr Nava Raipur), AGNIT and CG Power reaching volume production closes the MMIC capacity gap and unlocks the import-substitution thesis.
- 2030Cognitive EW at operational tempo. By 2030 the PLA is expected to field cognitive EW at scale (TRL 9); if India has not matched by then, the gap becomes operationally decisive. Also watch the first Indian EW export contract (Vietnam or Armenia).
Frequently Asked Questions
How big is India's electronic warfare market?
What share of GaN MMICs does India still import?
Why did Operation Sindoor change Indian EW planning?
What is Project Pragyashakti and why does it matter?
How long does India take to deliver a defence system?
Sources & Methodology
- Ministry of Defence, Government of India — Annual Reports 2024-25, 2025-26; DAC/AoN disclosures.
- Bharat Electronics Limited — Annual Reports FY22–FY26 (turnover ₹26,750 Cr, order book ₹74,000 Cr).
- Astra Microwave Products Limited — Annual Reports FY24/FY25; Q1 FY27 investor presentation.
- Defence Research and Development Organisation — SAMANVAY 2025 disclosures; SSPL/GAETEC publications.
- International Institute for Strategic Studies — The Military Balance 2025.
- Center for Strategic and International Studies — China Power Project (Yaogan-30 constellation).
- Jane's Information Group — Radar and Electronic Warfare Systems; Defence Weekly.
- DGFT / Wassenaar Arrangement / MTCR — SCOMET 2024–25 updates; 28th Plenary outcomes.
- Wireless Planning & Coordination Wing — National Frequency Allocation Plan (NFAP 2022, 2024).
- Tracxn, Crunchbase, BSE/NSE filings — Indian defence-tech startup funding data.
Quantitative estimates relating to programme budgets, market sizes, indigenous-content percentages and technology readiness levels are illustrative analytical assessments derived from publicly available information and Techadyant Labs' proprietary modelling. Forward-looking figures are flagged [Modelled]; they are conditional analytical cases, not forecasts of certainty. See the full Methodology appendix.
Get the Full Report
The free edition is a 28-page briefing covering the thesis, the key numbers, the scenario envelope and the evidence framework. The full report runs to 98 pages with 30 figures, 10 tables and 11 appendices — the RF import-dependency matrix, the capability-gap matrix, the four-horizon roadmap, the company/startup/policy/funding databases and the three 2026–2035 market-sizing scenarios — every exhibit carrying a verification label.
Full Report — Digital Edition
Complete 98-page strategic-intelligence report — RF component import-dependency matrix, capability-gap matrix, BEL/Astra Microwave order-book analysis, the four-horizon roadmap and the three-scenario market model. Instant, secure PDF delivery after purchase.
Purchase Full ReportReport + Data edition (₹11,999) adds the EW Strategic Intelligence Workbook — market-sizing model, company/startup/policy/funding databases and forecast assumptions. Institutional and multi-seat licensing — [email protected]. GST applicable.
Free 28-Page Edition
Read the thesis, the key numbers and the scenario envelope before you buy. Forward-looking market-sizing figures are disclosed as conditional Techadyant modelled cases — the report is a sourced strategic review.
Read the free editionDelivered as a PDF from the Techadyant Labs library.
Unlock the complete report
You’re reading the free preview. The full analysis continues with six more sections and the downloadable PDF edition.
- 🔒04 · Water, power & land
- 🔒05 · The packaging layer
- 🔒06 · Who captures the value
- 🔒07 · The talent constraint
- 🔒08 · Second-order effects
- 🔒09 · What to watch · references
You’ll be asked to sign in, then complete a one-time secure purchase.