
India’s Critical Manufacturing Dependencies, 2026–2035
The $506 billion strategic import surface, decomposed into 312 localisable opportunity surfaces — and the ~$480 billion, largely private envelope to close it.

The Thesis
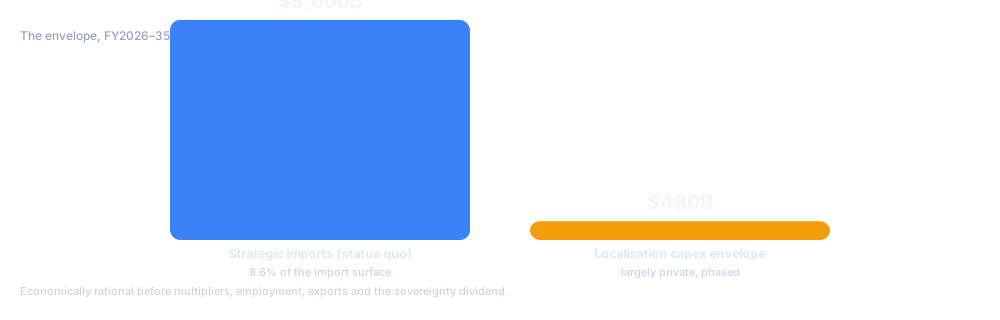
India does not have an import problem; it has an industrial-capability problem disguised as one. Every import line is a fingerprint of capability that does not yet exist at scale, quality or competitive cost — an opportunity surface, not an accounting entry. The Critical Manufacturing Dependency Index ranks the $506B strategic surface by danger, not value: localise the single-source chokepoints first, descend the industrial stack, and concentrate capital on 12 executable zones within a $480B FY2026–35 envelope — 8.6% of the $5.6T import bill it displaces.
Key Numbers
Key Findings
Chokepoints before volume
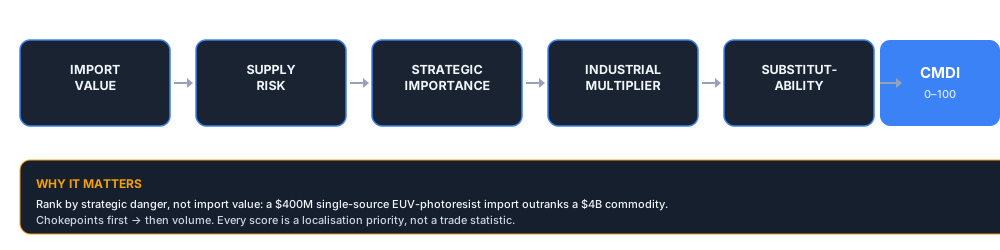
India imports $4.8B/yr of 7nm-and-below logic chips, every one from TSMC, Samsung or SMIC. A Taiwan-Strait event could collapse Indian electronics, auto, telecom and defence within 90 days. A $400M single-source import outranks a $4B commodity.
[Imperative 1 — Verified]The stack, not the assembly
A phone assembled in India captures 6–8% of factory-gate value; the rest accrues to components, IP and equipment abroad. The next decade must descend the stack: assembly → components → materials → machinery → test infrastructure.
[Imperative 2 — Verified]Twelve executable zones
Capital concentrates on 12 opportunity zones with capex from $200M (mobile assembly) to ~$11B (a 28nm logic fab — Tata–PSMC, Dholera), where latent capability and demand-side scale overlap.
[Imperative 3 — Ch 7]Capability, not incentives
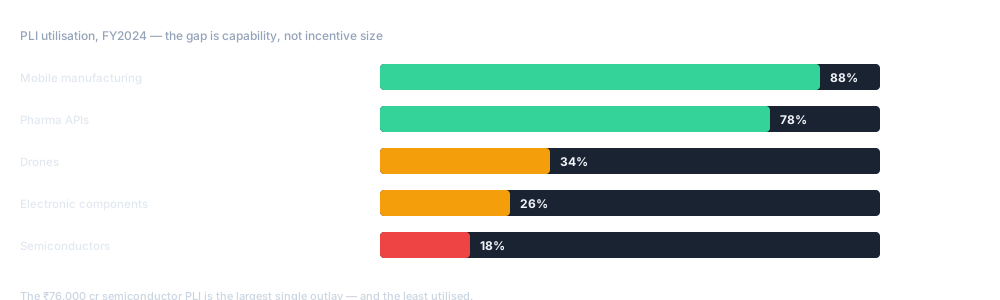
PLI utilisation runs 88% in mobile but 18% in semiconductors — despite the ₹76,000 cr (~$10B) semicon PLI, the largest single outlay. A subsidy cannot operate a fab without photoresist, lithography, engineers and IP.
[Imperative 5 — MeitY FY2024]The cluster gap
India’s strongest clusters (Bengaluru, Chennai, Pune, Hyderabad) score below 80 on the Ecosystem Density Index; global frontiers (Hsinchu, Shenzhen, Stuttgart, Suwon) score above 90. The deficit is Tier-2/3 suppliers and test infrastructure.
[Imperative 4 — Ch 5]Cost-parity discipline
Two rules govern every target: cost-parity (a localised product that never reaches competitive cost is a permanent subsidy) and a subsidy-exit condition. Otherwise dependency simply relocates onto the exchequer.
[Two Disciplines — Exec Summary]The Framework
The Critical Manufacturing Dependency Framework scores every strategically important imported product on ten proprietary indices — CMDI, LPI, IAI, SCI, TRI, EPI, SRI, IMI, NSRI and ICGI — each fully documented with formula, weightages and a worked example. Every product decomposes through a five-level taxonomy (finished product → subsystems → components → materials → machinery/test), because each layer is a distinct industrial opportunity. Every figure carries one of three confidence markers: Verified Fact (two+ independent primary sources), Reasoned Estimate, or Strategic Inference (documented, labelled). No invented data; no false precision.
What It Means
For policymakers: shift from incentive deployment to capability building. The ₹76,000 cr semiconductor PLI cannot operate a 28nm fab without photoresist, lithography, process engineers and IP — the register, cluster maps and technology roadmaps in this report are the prerequisite. Attach a subsidy-exit condition to every scheme.
For industry: value capture is downstream of assembly. Descent of the stack — components, specialty materials, machinery, test infrastructure — is where the industrial multiplier lives; the twelve zones name the clusters and the products.
For investors: the ~$480B envelope is overwhelmingly private and phased (~$48B/yr, under 10% of the annual bill it displaces). ROI multiples are highest in specialty chemicals, pharma APIs and EV power electronics; semiconductors and display carry the lowest direct multiple but the highest strategic and multiplier benefit.
The Numbers, Tabulated
| # | Opportunity surface | Sector | CMDI | LPI | IAI | Capex |
|---|---|---|---|---|---|---|
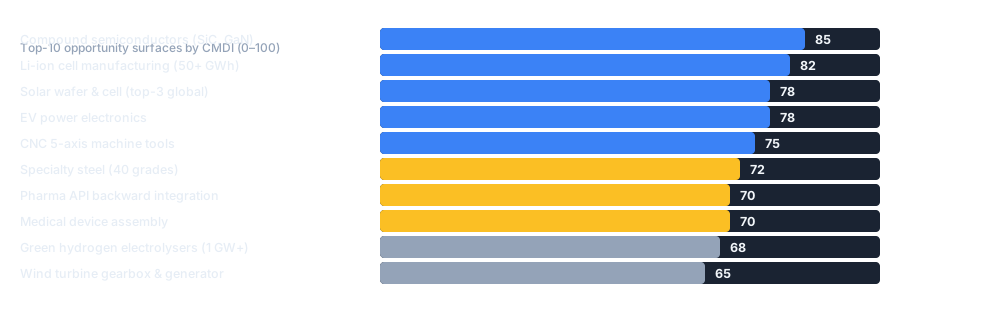
| 1 | Li-ion cell manufacturing (50+ GWh) | EV & Battery | 82 | 85 | 88 | $8B |
| 2 | Solar wafer & cell (top-3 global) | Renewable Energy | 78 | 78 | 82 | $6B |
| 3 | CNC 5-axis machine tools (Tier-2) | Industrial Machinery | 75 | 70 | 88 | $3B |
| 4 | Specialty steel (40 critical grades) | Specialty Materials | 72 | 80 | 70 | $5B |
| 5 | EV power electronics (inverters, OBC) | EV & Battery | 78 | 72 | 90 | $4B |
| 6 | Pharma API backward integration (50+) | Specialty Chemicals | 70 | 80 | 70 | $3B |
| 7 | Green hydrogen electrolysers (1 GW+) | Renewable Energy | 68 | 82 | 80 | $5B |
| 8 | Medical device assembly (MRI, CT, implants) | Medical Devices | 70 | 75 | 78 | $3B |
| 9 | Wind turbine gearbox & generator | Renewable Energy | 65 | 78 | 72 | $2B |
| 10 | Compound semiconductors (SiC, GaN) | Semiconductors | 85 | 62 | 80 | $12B |
| Chokepoint | Supply concentration | Domestic capability | Risk |
|---|---|---|---|
| EUV photoresist | Single-source: JSR / Tokyo Ohka / Shin-Etsu (Japan) | Near-zero | Extreme |
| Leading-edge logic ≤7nm | $4.8B/yr; TSMC / Samsung / SMIC only | None at scale | Extreme |
| Combat aero-engines | Concentrated OEM supply; multi-year lead times | Fleet under development | High |
| DRAM & NAND memory | 3 suppliers; ~90%+ Korea/China capacity | None at scale | High |
What to Watch
- FY26–27CMDD Edition I baseline — first annual read of the 312-surface register; watch which zones clear feasibility and which stall on water, power and land constraints.
- FY2030Localisation unlocks a $215B export potential; mobile, pharma, autos and EV components are the highest-potential categories.
- 2032With execution, India can become the third-largest manufacturing economy.
- 2035Without action, the annual strategic import bill exceeds $1.2 trillion (~18% of projected GDP) — a perpetual structural deficit driven by intermediates and capital goods.
Frequently Asked Questions
What is the Critical Manufacturing Dependency Index?
The CMDI is a 0–100 score of how strategically import-dependent India is for a product, weighting import value, supply risk, strategic importance, industrial multiplier and substitutability. It ranks by strategic danger rather than import value, so single-source chokepoints surface above large commodities.
How many products does the report cover?
The report identifies, scores and decomposes 312 strategic opportunity surfaces across twelve mega-sectors, drawn from roughly $506 billion of strategic imports within India’s $672 billion annual merchandise import bill.
What are India’s deepest manufacturing dependencies?
The deepest combine high import value, concentrated foreign supply and near-zero domestic capability: EUV photoresist, leading-edge logic chips (7nm and below), combat aero-engines, and DRAM and NAND memory. Every one is effectively single-source.
How much capital would localisation require?
Roughly $480 billion of largely private, phased capital over 2026–2035, concentrated on twelve executable opportunity zones — set against about $5.6 trillion of strategic imports over the same period if current trajectories continue.
What are the twelve opportunity zones?
Semiconductors and display (Dholera, Hosur), Li-ion cells (Chennai–Hosur–Sri City), solar wafers and cells (Mundra, Visakhapatnam), defence aerospace (Bengaluru, Hyderabad), medical devices (Ahmedabad, Hyderabad), specialty chemicals (Ankleshwar–Vadodara, Vapi), CNC machine tools (Bengaluru, Coimbatore), green hydrogen electrolysers (Mundra, Paradip), wind gearboxes (Chennai, Mundra), telecom/5G (Sri City, Manesar), EV power electronics (Pune, Sanand), and pharma APIs (Hyderabad, Vizag).
Does the report address the subsidy trap?
Yes — it is treated as the most serious objection. Every target carries a cost-parity and subsidy-exit condition: the test is not whether India can make a thing, but whether it can make it at a cost a downstream buyer would choose unsubsidised within a defined horizon.
Sources & Methodology
Derived from India’s Critical Manufacturing Dependencies Edition I (2026). Confidence markers: Verified Fact / Reasoned Estimate / Strategic Inference. Primary sources:
- UN Comtrade + DGCI&S trade data, FY2024 [Verified]
- Ministry of Commerce; Ministry of Electronics & IT disclosures on PLI utilisation, FY2024
- Company annual reports and regulatory filings (fab, cell, machinery projects)
- Techadyant Labs proprietary models — CMDI, LPI, IAI and seven companion indices [CMDD Database]
Get the Full Report
132-page PDF · 13 chapters · 46 tables · 30 figures · full CMDD database and appendices (Report + Data pack).
Buy Report — ₹6,999Report + Data pack — ₹11,999Free Condensed Edition
16 pages — the thesis, the framework and the headline findings, with figures.
16-page condensed edition (PDF). Free to read here; subscribe with an email to download the PDF. We'll also tell you when this assessment changes.
Free · no spam · unsubscribe anytime · privacy policy