
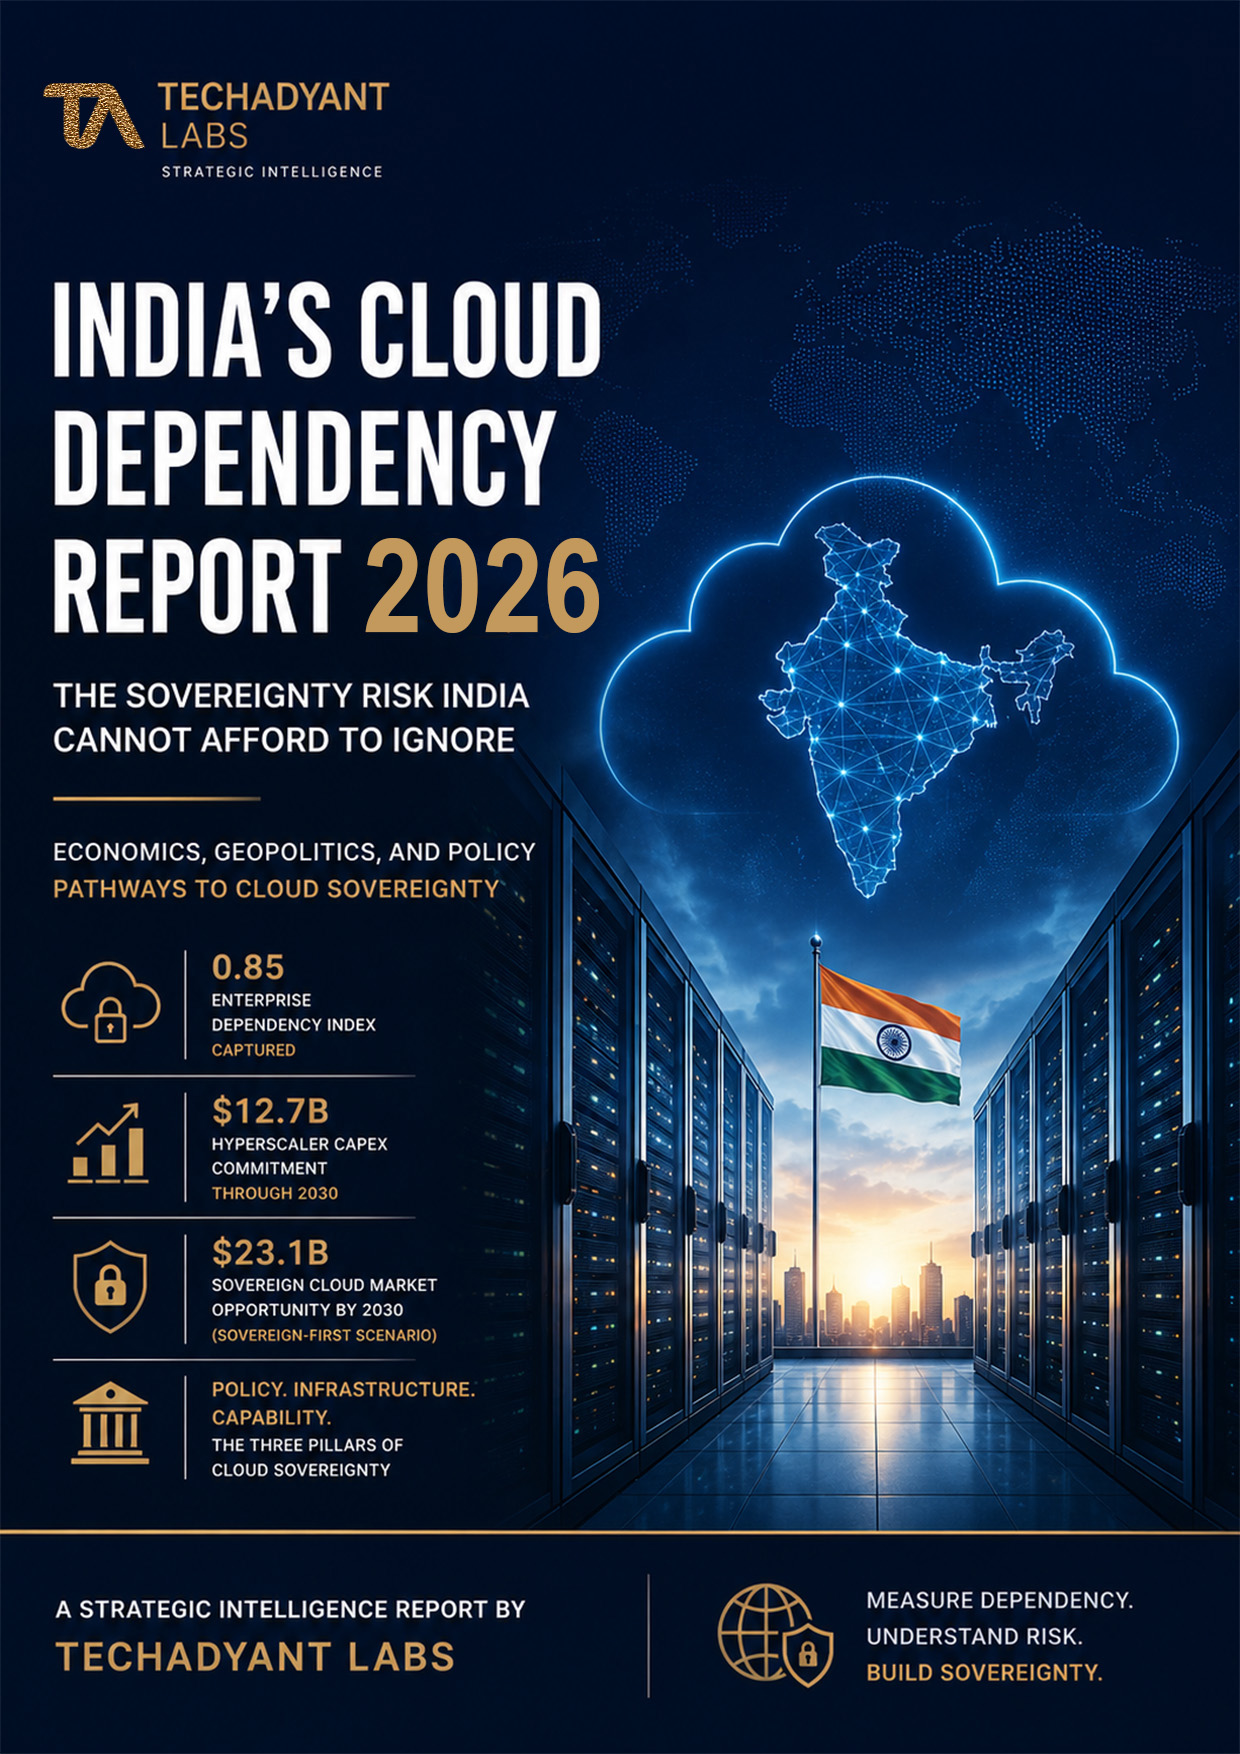
The Thesis
India's cloud dependency is real, measurable, and concentrated in the platform and AI layers, while physical infrastructure remains a relative strength. The composite Enterprise Dependency Index (EDI) stands at 0.63, peaking at 0.77 for AI infrastructure and falling to 0.35 for physical infrastructure. Only 2–4% of national workloads genuinely require sovereign control. The commercially viable answer is not a domestic AWS clone but a tiered strategy: sovereign control for critical workloads, regulated controls for high-sensitivity data, and open multi-cloud for the remaining 84–90% of the estate.
Key Numbers
Key Findings
Dependency is layered, not monolithic. India's cloud problem is a platform and silicon problem, not a data-centre problem — control is lost as you climb the stack.
0.77 AI vs 0.35 physical EDI
Techadyant Analysis ◆ Chapter 6Concentration is the root condition. The Big Three hold an estimated 70–80% of Indian enterprise workloads, converting vendor decisions into national exposures.
63% global infra share (Q3 2025)
Synergy Research Group ◆ SRC-003Exit is priced, and it is bounded. Re-platforming engineering, not egress fees, dominates the exit bill. Portability is an architectural discipline, not a hope.
2–7% of annual workload spend
Techadyant Model ◆ Chapter 44Jurisdiction is the sharpest edge. The US CLOUD Act reaches Indian-hosted data on US platforms with no treaty channel for India; DPDP Rules cannot nullify a US order.
Conflict zone: T1 & T2 workloads
US DOJ / Techadyant ◆ SRC-040Physical infrastructure is India's strength. Indian capital dominates shells and power, with operational capacity headed toward multi-gigawatt scale by 2030.
~1.6 GW (mid-2026) → 6–12 GW (2030)
JLL / ICRA ◆ SRC-023/024Startup dependency is highest. Startups score 0.69 on the EDI, locked in by credits, managed services, and marketplace distribution defaults.
64% hold material cloud-credit dependencies
Techadyant Estimate ◆ Chapter 40The Framework
Enterprise Dependency Index (EDI). Techadyant's proprietary scoring model measures cloud dependency across eight dimensions — market concentration, switching cost, strategic control, substitution feasibility, technology dependency, jurisdictional exposure, ecosystem dependency, and infrastructure dependency — on a 0–1 scale, where 0 means credible sovereign capability and 1 means captured foreign dependency.
Five-tier workload classification. A policy framework categorising the national estate into T1 (sovereign-required, 2–4%), T2 (high-sensitivity, 8–12%), T3 (regulated commercial, 18–25%), T4 (general commercial, 30–38%) and T5 (commodity / edge, 25–35%) — so mandates are calibrated to actual risk rather than provider nationality.
What It Means
For Policymakers
Legislate by workload tier, not by provider nationality. Fund the GPU commons to scale, fix MeghRaj's supply side through tier-gated procurement templates, and resist the temptation of a domestic AWS clone that the economics do not support. Measurement matters: mandate annual disclosure of public-sector workload placement. For the running policy view, see our Signals coverage.
For Industry (CEOs & CIOs)
Treat cloud concentration as a board-level risk with a measured price tag. Quantify workload-by-workload exit prices, enforce portability standards in every new build, and keep AI model access multi-vendor. A 10–20% second-vendor allocation buys optionality at single-digit cost and strengthens negotiating positions. Company and platform profiles sit in the Techadyant Atlas.
For Investors
The investable sovereignty thesis is narrow. Concentrate capital on the four segments where dependency intensity, policy support and commercial economics intersect: GPU cloud, sovereign and regulated-sector cloud, cloud security and compliance, and multi-cloud orchestration. Avoid general-purpose hyperscale IaaS clones. The full method is documented in the Methodology volume.
Analytical Figures
Dependency is not uniform across the technology stack. India has built genuine physical data-centre capacity, but the layers above it — Platform-as-a-Service and AI infrastructure — are the most severe points of foreign control. The EDI gradient is stark: physical infrastructure is a relative strength, but as you climb to managed services, proprietary APIs and accelerator silicon, the dependency score rises sharply into the high-risk band.
The strategic implication is clear: building another commodity IaaS cloud attacks the layer where India already holds a 0.35 EDI and where foreign providers compete hardest on price. Capability investment must instead target the 0.70+ layers — AI infrastructure, managed databases, identity and orchestration — where dependency actually converts into strategic control.
The GI Cloud (MeghRaj) initiative is the government's primary framework for cloud adoption. Over the past decade the number of departments using empanelled cloud services has grown roughly five-fold, reflecting a broad institutional shift toward cloud-native architectures for citizen services and administrative workloads.
Despite the five-fold rise, government cloud adoption remains a minority practice: an estimated 30–45% of government digital workloads still run on foreign-operated clouds outside formal frameworks. The framework is sound; supply-side capability and talent remain the binding constraints.
Blanket sovereignty mandates across the entire estate would raise costs, slow AI adoption and achieve little strategic protection. The Techadyant framework classifies workloads by consequence, not data volume — applying stringent controls only where the severity of coercion, denial or compromise justifies the economic trade-off.
This classification converts an unanswerable political question into answerable engineering decisions per workload. It also creates the measurement basis policy currently lacks: tier shares can be audited, reported annually and steered by procurement mandates — without disrupting the 84–90% of the estate that is efficiently served by foreign hyperscalers under Indian law.
The Numbers, Tabulated
Table 1 — Workload Sovereignty Classification
| Tier | Definition | Share of estate | Requirement set |
|---|---|---|---|
| T1 Sovereign-required | State functions where foreign control is intolerable | 2–4% | Indian-controlled stack; restricted supplier list |
| T2 High-sensitivity | Regulated or crown-jewel data and processes | 8–12% | India residency; customer-managed keys; tested exit |
| T3 Regulated commercial | Supervised industries' ordinary workloads | 18–25% | Attestations; materiality classification; real multi-cloud |
| T4 General commercial | Competitive-economy workloads | 30–38% | Concentration hygiene; portability standards |
| T5 Commodity / edge | Low-sensitivity scale workloads | 25–35% | Price optimisation; standard portability |
Table 2 — Scenario Outcomes for 2030
| Indicator (2030) | S1 Market-Led | S2 Managed Sovereignty | S3 Sovereign-First | S4 Fragmented Drift |
|---|---|---|---|---|
| Cloud market ($B) | 26–30 | 24–28 | 20–25 | 19–24 |
| Sovereign share of estate | 3–5% | 8–12% | 15–22% | 4–7% |
| Indian provider share | 9–12% | 14–18% | 22–28% | 8–11% |
| EDI change vs 2026 | −0.03 | −0.08 | −0.15 | +0.02 |
What to Watch
- 2026–2027 MeghRaj 2.0 notification: publication of tier-gated procurement templates and per-tier empanelment control requirements, converting policy into binding purchase orders.
- 2027–2028 Certified sovereign offers: emergence of Indian-certified operational-sovereignty models (akin to France's S3NS) — Indian legal entities, local staff and customer-held keys.
- 2028–2030 T2 migration cycle: phased migration of the estimated 30–45% foreign-hosted government T2 workloads on renewal cycles, gated by domestic platform capability.
- 2026–2028 GPU commons scaling: the utilisation economics of the IndiaAI Mission's 38,000+ GPUs will decide whether the sovereign compute floor expands or becomes a scarce queue captured by incumbents.
Frequently Asked Questions
What is India's Enterprise Dependency Index (EDI) for cloud?
What percentage of Indian workloads require sovereign cloud control?
How much does it cost to switch cloud providers in India?
How many GPUs has the IndiaAI Mission onboarded?
What is the projected data-centre capacity in India by 2030?
Sources & Methodology
Every material claim in this report carries an evidence label (FACT / ESTIMATE / ASSUMPTION / TECHADYANT ANALYSIS / FORECAST / SCENARIO) and a confidence grade, underpinned by 44 claim-level source records (SRC-001..SRC-044). Where data is not publicly available, the deliverables state so. Primary sources for the figures above include:
- Gartner (Jun 2026): India public cloud spend forecasts (SRC-001).
- Synergy Research Group (Nov 2025): global cloud-infrastructure market shares (SRC-003).
- MeitY / PIB: IndiaAI Mission GPU onboarding (SRC-015) and MeghRaj adoption metrics (SRC-021).
- JLL / ICRA / Wood Mackenzie (2024–2026): India data-centre capacity forecasts (SRC-023, SRC-024, SRC-025).
- US Department of Justice / legal scholarship: CLOUD Act extraterritorial reach analysis (SRC-040).
- Techadyant Labs proprietary models: Enterprise Dependency Index, switching-cost model and the five-tier workload classification (MEDIUM–HIGH confidence, documented in the accompanying workbook).
Get the Full Report
The free edition is a standalone 25-page briefing capturing the thesis, the key numbers and the tiered strategy. The full report runs to 119 pages across 14 parts, 150 chapters and 52 exhibits, with international benchmarks (US, EU/GAIA-X, China, UK, Japan, South Korea, Singapore, Saudi Arabia, UAE), the four-scenario 2030/2035 model and ten appendices.
Full Report — Digital Edition
Complete 119-page strategic-intelligence report — full body chapters, 52 exhibits, executive summary and appendices. Instant, secure PDF delivery after purchase.
Purchase Full ReportInvoice available for institutional buyers. GST applicable.
Report + Data Workbook
Full report plus the Cloud Sovereignty Intelligence Workbook — the live-formula Excel model behind every figure: the EDI model, switching-cost calculator, scenario engine, opportunity scoring and the claim-level source register.
Purchase Report + DataIncludes source attribution for every data point. Model assumptions documented.
Free Condensed Edition
Read the 25-page free edition, or subscribe for quarterly updates on India's cloud-sovereignty landscape. No spam, no third-party sharing.
Subscribe for updatesBy subscribing, you agree to receive quarterly research updates from Techadyant Labs. Unsubscribe at any time.
Unlock the complete report
You’re reading the free preview. The full analysis continues with six more sections and the downloadable PDF edition.
- 🔒04 · Water, power & land
- 🔒05 · The packaging layer
- 🔒06 · Who captures the value
- 🔒07 · The talent constraint
- 🔒08 · Second-order effects
- 🔒09 · What to watch · references
You’ll be asked to sign in, then complete a one-time secure purchase.