
Beyond Sea Drones: India’s Maritime Autonomy, 2026–2035
The subsystem, software and supply-chain map of the ₹55,000 crore opportunity — scored across 12 nations, 100 opportunities and 125 tiered sources.
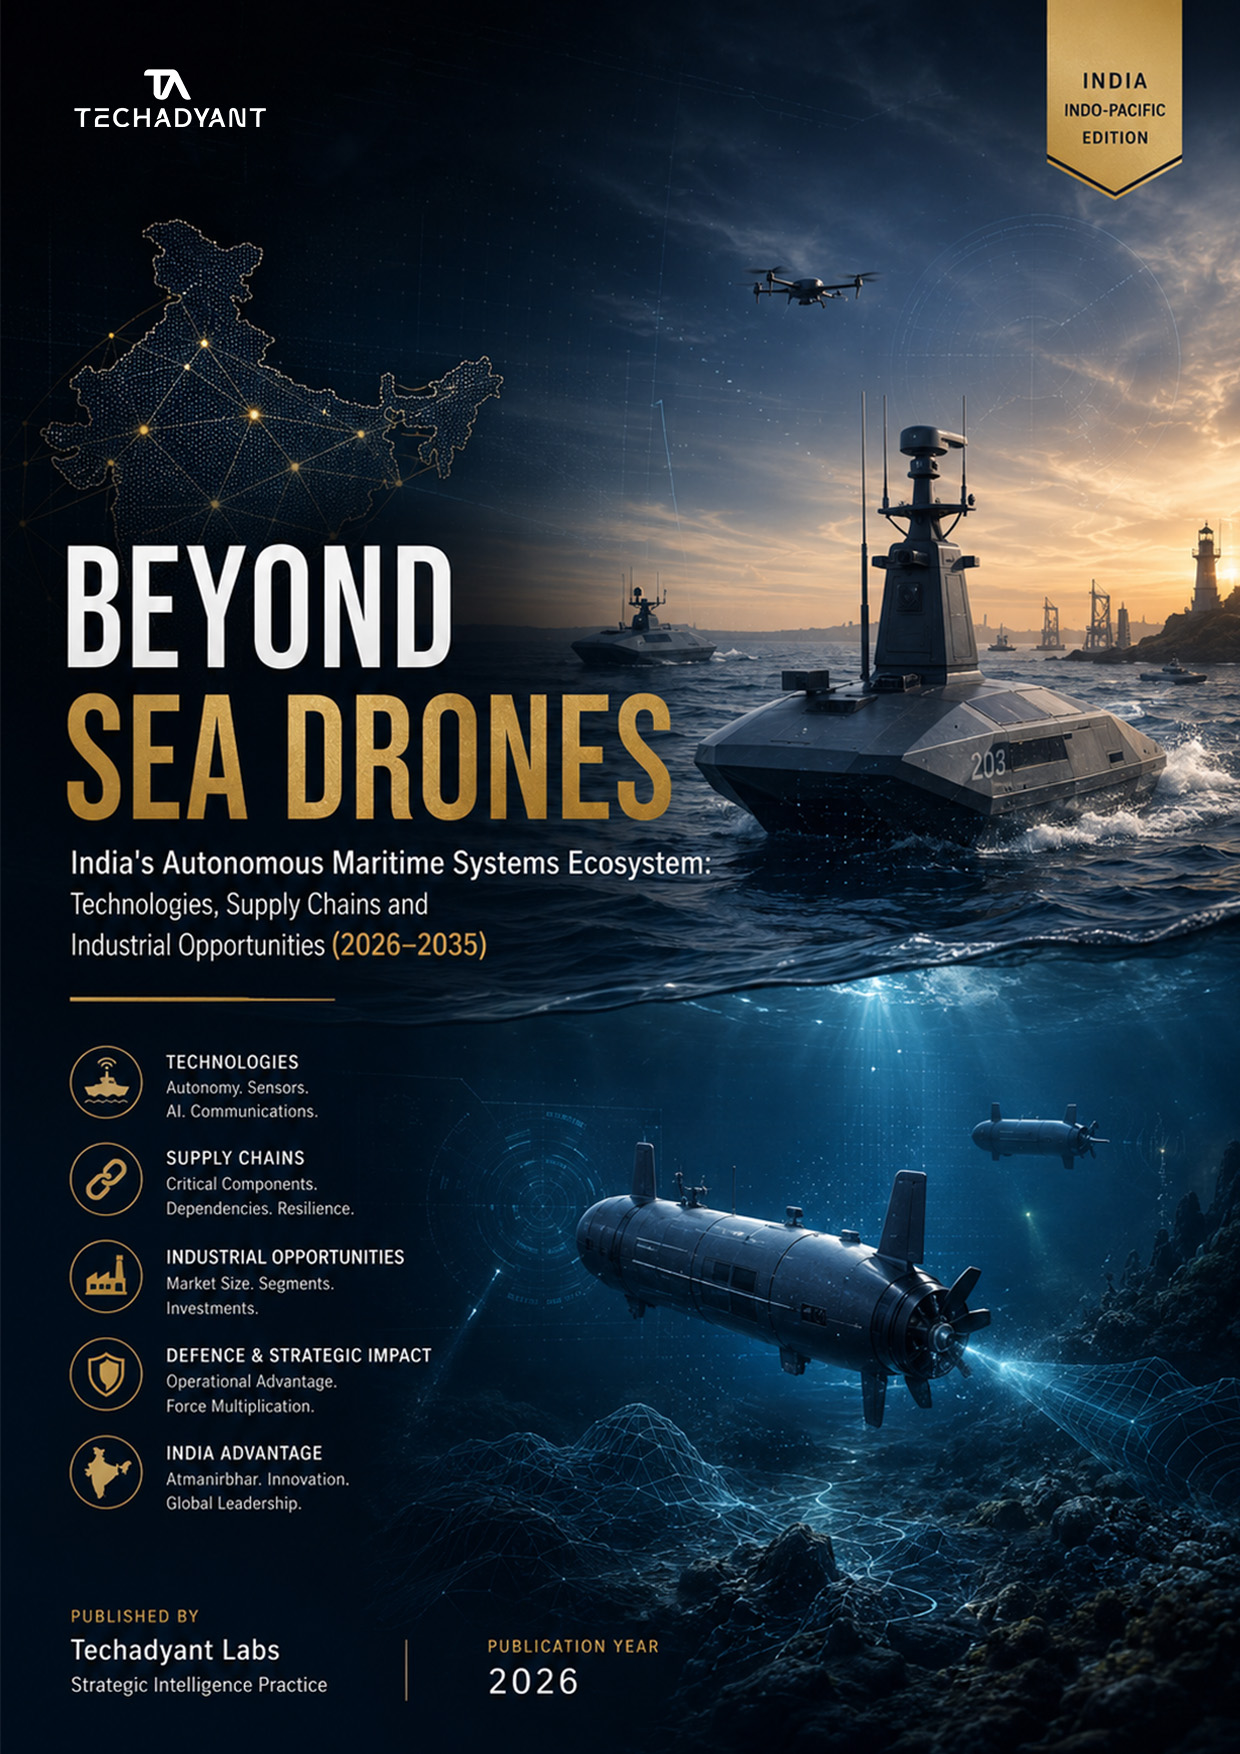
The Thesis
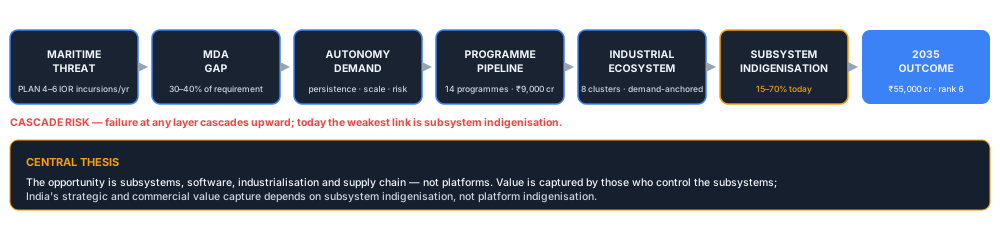
Techadyant Labs’ 2026 assessment finds India’s autonomous maritime sector faces a structural “subsystem gap”: while hull fabrication is domestic, critical components like AI compute (15% indigenous) and battery cells (35%) remain import-dependent. The report forecasts a ₹55,000 crore market by 2035, contingent on a ~₹14,600 crore Phase I (2026–30) capital requirement. India ranks 9th of 12 nations on the Maritime Autonomy Readiness Index, with specific vulnerabilities in edge compute and energy storage threatening strategic sovereignty.
Key Numbers
Key Findings
Market trajectory
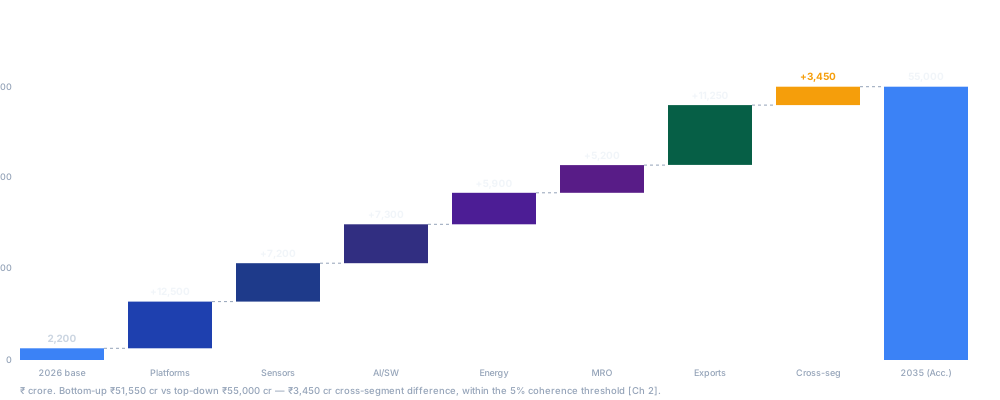
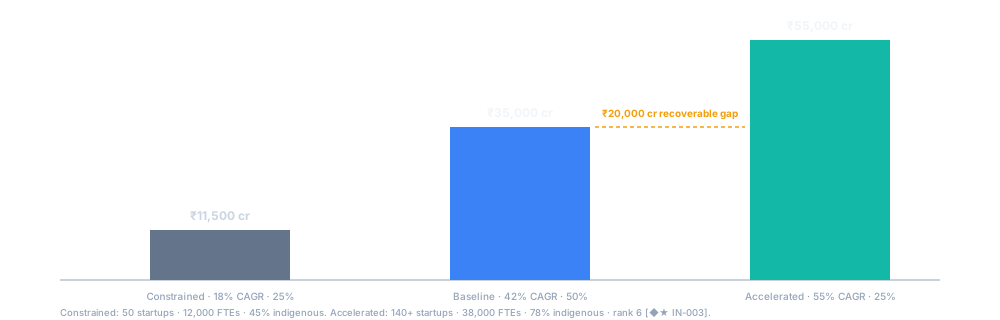
The sector grows from a ₹2,200 crore baseline in 2026 to ₹55,000 crore by 2035 under the Accelerated scenario (55% CAGR), driven by attach economics in sensors, AI and software rather than hull volume.
[Techadyant Model — IN-003; Ch 2]Readiness gap
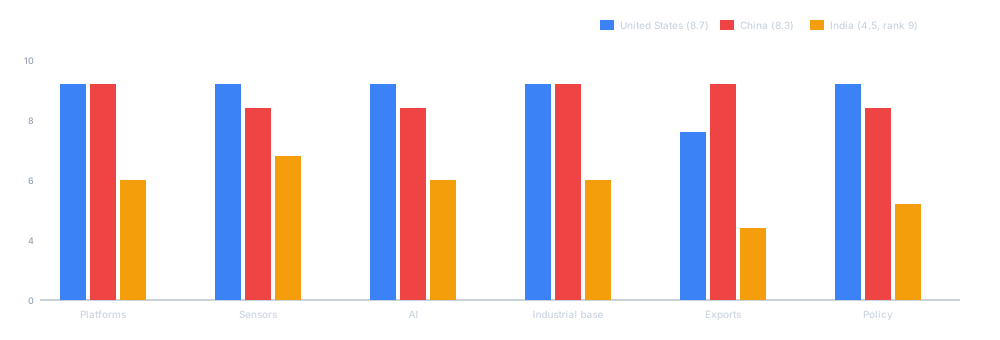
India ranks 9th of 12 with a composite 4.5/10, trailing leaders in exports (3.0) and policy (4.0) while anchoring on sensors (6.0) via NPOL/BEL sonar.
[Readiness Index — IN-014, IN-022; Ch 8]Subsystem dependency
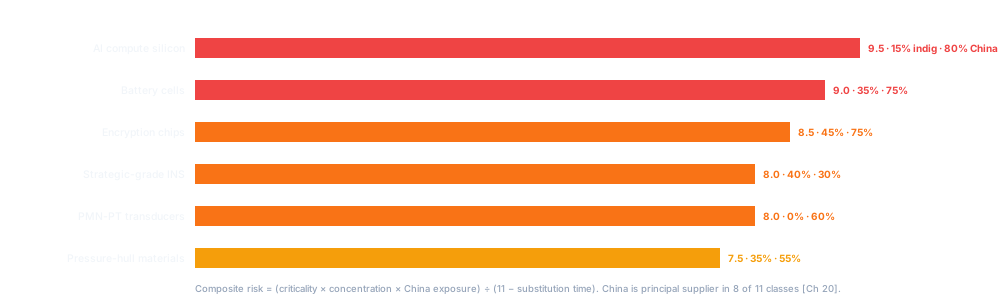
AI compute silicon is 15% indigenous, battery cells 35%, strategic-grade INS 40% — a “hollow platform” risk, with China concentrating 60–80% of supply in critical classes.
[Dependency Index — IN-022–IN-061; Ch 20]ASW economics
Autonomous architectures close ~50% of the widening ASW coverage gap (index 100→175 by 2035) at ~20% of equivalent manned cost.
[ASW Analysis — IN-007, IN-014; Ch 5]Export window
A $8–10 billion export TAM exists across ASEAN, Gulf and East African forces (2028–2034); 6–10% capture equals ₹6,500 crore/yr by 2035.
[Export Thesis — IN-087; Ch 1]Value capture
Value capture is highest in AI/software (75%), MRO (75%) and sensors (70%); lowest in edge compute (15%) — the semiconductor-dependent layer.
[Value Capture Map — IN-003; Ch 13]The Framework
The Maritime Autonomy Readiness Index scores 12 nations across nine weighted dimensions (platforms 15%, sensors 15%, AI 15%, communications 10%, propulsion 10%, energy 10%, industrial base 15%, exports 10%, policy 10%) on a 0–10 scale. The Dependency Capture Framework maps the “hollow platform” risk: a hull may be Indian, but if the brains (silicon) and energy (cells) are imported, strategic sovereignty is compromised. Every number carries a FACT / ESTIMATE / INFERENCE / FORECAST symbol traceable to the 125-citation register.
What It Means
For policymakers: the ~₹14,600 crore Phase I requirement is not new money but a reallocation (~3% of MoD capital) that unlocks a 3–5x private-capital multiplier. Without the 2026 policy notification, the Karwar deep-water range (2027) and the Autonomous Systems Certification Authority (ASCA, 2027), the ecosystem remains fragmented.
For industry: the value is in the stack, not the hull. Sensors (70% capture) and AI (75%) are the profit pools; edge compute (15%) is the vulnerability. Shipyards must pivot to primes integrating high-value subsystems, per the South Korea model.
For investors: the Series B+ valley of death requires mandated sovereign co-investment (25–50%). Target IRRs: 14–18% sovereign-aligned, 25–35% growth VC, 20–25% PE. The exit is strategic acquisition by DPSUs or global primes, not IPO.
The Numbers, Tabulated
| Scenario (prob.) | 2035 market | CAGR | Startups | FTEs | Indigenisation | Rank |
|---|---|---|---|---|---|---|
| Constrained (25%) | ₹11,500 cr | 18% | 50 | 12,000 | 45% | 8–9 |
| Baseline (50%) | ₹35,000 cr | 42% | Intermediate — real programmes, no ecosystem | |||
| Accelerated (25%) | ₹55,000 cr | 55% | 140+ | 38,000 | 78% | 6 |
| Critical subsystem | Indigenous | China concentration | Composite risk |
|---|---|---|---|
| AI compute silicon | 15% | 80% | 9.5 |
| Battery cells | 35% | 75% | 9.0 |
| Encryption chips | 45% | 75% | 8.5 |
| Strategic-grade INS | 40% | 30% | 8.0 |
| Pressure-hull materials | 35% | 55% | 7.5 |
| # | Opportunity | Domain | TRL | 2035 market | OPI |
|---|---|---|---|---|---|
| 1 | 11m ASW USV | Platform-surface | 6 | $420M | 88 |
| 2 | LFP battery module | Energy | 8 | $480M | 86 |
| 3 | Man-portable AUV | Platform-subsurface | 6 | $220M | 84 |
| 4 | Maritime Perception AI | AI/Software | 6 | $320M | 84 |
| 5 | Stabilised EO/IR payload | Sensor | 8 | $320M | 84 |
| 6 | Battery management system | Energy | 8 | $220M | 84 |
What to Watch
- 2026Notification of the Autonomous Maritime Industrial Policy and launch of the ₹2,000 cr/yr Anchor Programme (2026–28), scaling to ₹4,200 cr/yr by 2030.
- 2027Karwar deep-water test range operational and the Autonomous Systems Certification Authority (ASCA) established.
- 2028MGR Mark II fleet (12 units) in service and indigenous PZT sonar transducers qualified at scale.
- 2032First export order to an Indo-Pacific partner — validating the $8–10B TAM before the window closes in 2034.
Frequently Asked Questions
How big is India’s autonomous maritime systems market by 2035?
₹11,500 crore (Constrained), ₹35,000 crore (Baseline) or ₹55,000 crore (Accelerated) by 2035, from a ₹2,200 crore 2026 baseline. The Accelerated case assumes a 2026–27 anchor-programme decision; the report sizes the ₹20,000 crore gap recoverable through early decisions.
Where does India stand in maritime autonomy today?
Rank 9/12 on the Maritime Autonomy Readiness Index with a composite 4.5/10. Fourteen active programmes and eight iDEX awards exist, but the subsystem base is 15–70% indigenous and there is no certification authority. The gap is industrial, not technological.
What are India’s critical gaps in USV/UUV subsystems?
AI silicon (~15% indigenous), battery cells (~35%), certification, and a 36–60 month procurement cycle versus 12–24 months for the US. The Dependency Index scores 40+ subsystems for sovereignty to separate strategic chokepoints from manageable ones.
What is the biggest autonomous maritime opportunity for India?
One hundred opportunities scored on the 9-dimension Opportunity Priority Index (OPI); 24 “Star” opportunities score 80+, led by an 11-metre ASW USV at 88. Twenty-five hidden opportunity surfaces sit in the supporting ecosystem — subsystems, test ranges, certification — not platforms.
Why is this report different from other market studies?
Every major claim is a numbered, verification-labelled citation [IN-XXX] against 125 sources across six source tiers. Fact, estimate, inference and forecast are visibly separated, and the full dataset ships in a 17-sheet Excel workbook mirroring appendices D–K.
Sources & Methodology
Derived from Beyond Sea Drones v2.0 (2026). Evidence labels: [V] verified · [V1] single-source · [U] unverified · [modelled]. Primary sources:
- Ministry of Defence, Annual Report 2024–25 [IN-056, IN-057]
- Indian Navy, Maritime Perspective & Capability Plan 2030 [IN-018]
- DRDO Yearbook 2024; NPOL/NSTL technical publications [IN-016, IN-020, IN-022]
- US Department of the Navy, CNO Navigation Plan 2024; UK MASS Regulatory Framework [IN-093, IN-048]
- Techadyant Labs proprietary models — Market sizing, Readiness Index, Dependency Index [IN-003, IN-014]
Get the Full Report
136-page PDF · ~3h read · 51 exhibits · 125 tiered citations · 17-sheet Excel workbook (Report + Data pack).
Buy Report — ₹6,999Report + Data pack — ₹9,999Free Condensed Edition
27 pages — the thesis, the framework and the headline findings, with figures.
27-page condensed edition (PDF). Free to read here; subscribe with an email to download the PDF. We'll also tell you when this assessment changes.
Free · no spam · unsubscribe anytime · privacy policy