
Beyond Solar Panels
India built the world’s largest solar-deployment machine — 162.15 GW by June 2026. Value and vulnerability live upstream of the panel: polysilicon, wafers, cells, glass, gases, chemicals and equipment.

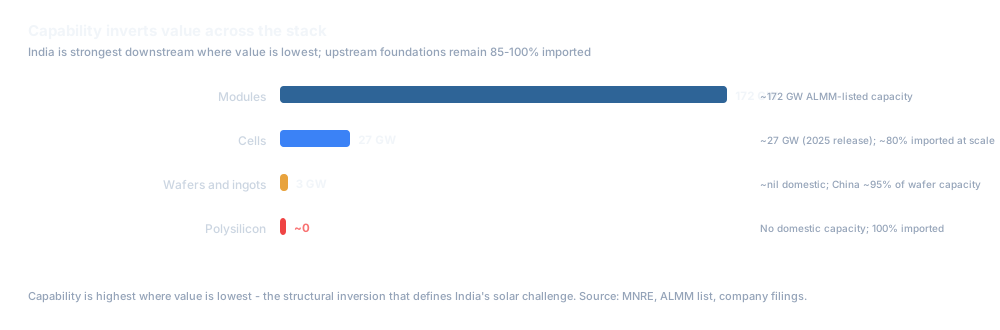
Module capacity ~172 GW (ALMM), but polysilicon, wafers, chemicals, gases and equipment stay 85–100% imported.
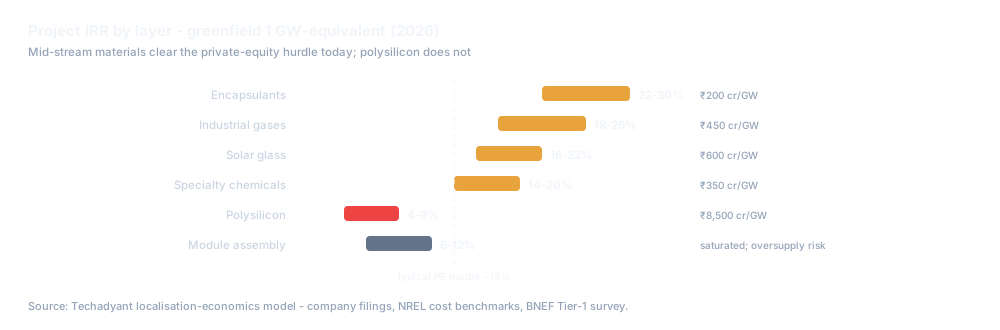
Glass (16–22%), gases (18–26%), chemicals (14–20%) and encapsulants (22–30%) clear the hurdle; polysilicon returns only 4–9% IRR.
The perovskite-silicon tandem transition, Western tariffs and rising Chinese costs all narrow the opening after 2030.
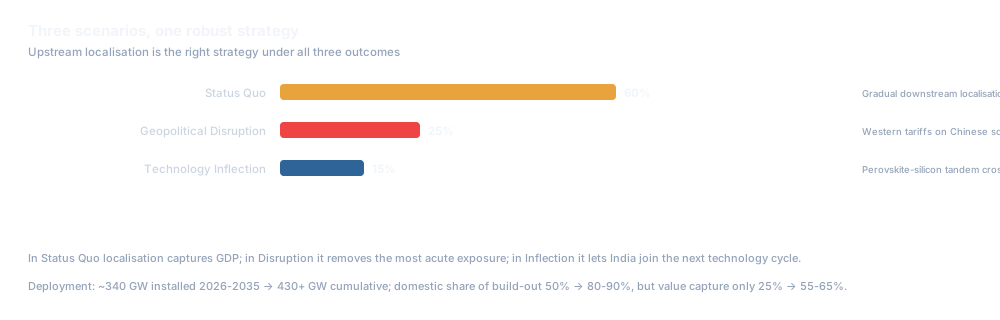
It wins under Status Quo (60%), Geopolitical Disruption (25%) and Technology Inflection (15%) alike.
The Thesis
India assembles solar modules; it does not yet manufacture them. Deployment has outrun industrial depth: 162.15 GW installed against ~172 GW of ALMM-listed module capacity, while the upstream foundations — polysilicon, ingots, wafers, specialty chemicals, industrial gases, equipment — remain 85-100% imported. The strategic question is not how many gigawatts India can install; it is how much industrial value it captures along the way, and whether it owns the industrial base that determines its energy autonomy through 2050.
Key Numbers
Key Findings
India assembles; it does not yet manufacture
Module capacity has scaled to ~172 GW (ALMM), but the upstream foundations - polysilicon, ingots, wafers, specialty chemicals, industrial gases, equipment - remain 85-100% imported. Capability inverts value: India is strongest exactly where value is lowest. Capacity without upstream depth is assembly with a flag on it.
[Exec Summary - Verified]The most valuable opportunities are materials, not polysilicon
Polysilicon needs ₹8,500 cr/GW, 5-7 years to commission, and returns 4-9% IRR - barely above the cost of debt. Solar glass offers 16-22% at ₹600 cr; industrial gases 18-26% at ₹450 cr; specialty chemicals 14-20% at ₹350 cr; encapsulants 22-30% at ₹200 cr - and China’s grip there is 50-65%, not 80-95%.
[Finding 2 - Ch 6]China’s advantage is a 15-year policy stack
Subsidised capital at 2-3% (vs 8-10% in India), power at $0.03-0.04/kWh (vs $0.07-0.09), 13% export VAT rebates, near-zero land, and co-located clusters worth a 10-15% cost advantage. No single subsidy was decisive; the stack was.
[Finding 3 - Ch 4]The window is 5-7 years
Three forces narrow it after 2030: the perovskite-silicon tandem transition (crossing 30% efficiency at scale by 2031-33), Western tariffs shrinking Chinese export volumes, and rising Chinese costs. Missing 2026-2030 means importing more expensive, less reliable supply chains for decades.
[Finding 5 - Ch 11]Localisation is robust to all scenarios
Status Quo 60% (₹1.2 lakh cr/yr leakage easing to ₹60-80k cr by 2035), Geopolitical Disruption 25% (35-50% price spikes, 3-5 year delay), Technology Inflection 15% (tandem strands PERC capex). Upstream localisation wins under all three - it captures GDP, removes exposure, or positions India for the next technology cycle.
[Ch 10 - Scenario model]Capital is misallocated
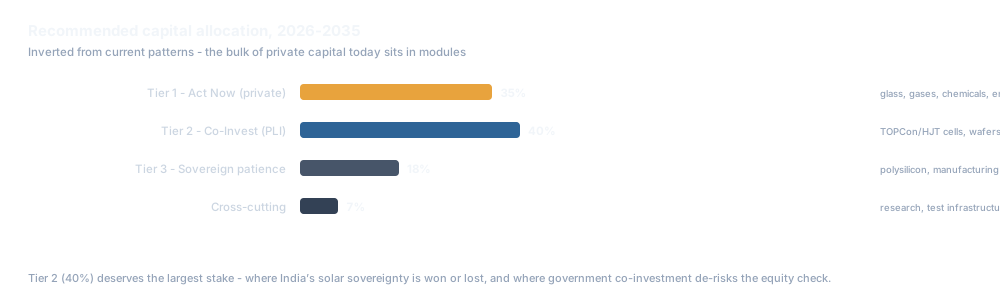
The bulk of private capital flows into modules - a saturated segment where 25+ credible Indian module makers fall to 10-12 by 2030 - while Tier 1 materials stay under-invested. The report’s inversion: 35% Tier 1, 40% Tier 2, 18% Tier 3, 7% cross-cutting.
[Investment thesis - Ch 12]The Framework
The report’s analytical core is the localisation-economics model: 16 layers of the solar manufacturing stack, each assessed as a greenfield 1 GW-equivalent facility under baseline assumptions (debt-equity 70:30, cost of debt 9.5% post-PLI, 15% straight-line depreciation, 25.17% corporate tax). Three supporting frameworks sit on top: the Solar Capability Maturity Model, the State Readiness Index, and a three-tier Investment Tiering Framework mapping opportunity layers to investor categories and horizons. External facts are traced to dated sources; modelled outputs are labelled; projections are scenarios, not forecasts. The companion workbook carries the underlying datasets for every exhibit.
What It Means
For policymakers: expedite PLI Tranche 3 targeting equipment, specialty chemicals and tandem perovskite R&D; maintain the 20% BCD + 20% AIDC structure through 2030; designate co-located clusters in Gujarat, Tamil Nadu and Telangana; build domestic test and certification (NISE, NABL, IEC).
For industry: the sequence is not optional - materials first (2026-28), cells and wafers next (2028-31), polysilicon and equipment last (2031-35). Avoid pure-PERC module additions post-2027; move to TOPCon now, prepare HJT and back-contact by 2028, and tandem pilots by 2029-31.
For investors: invert the allocation. Tier 1 materials clear private-equity hurdles today (16-30% IRR); Tier 2 needs PLI co-investment; Tier 3 needs sovereign patience. The most defensible startup niches are factory intelligence, inspection and metrology, and module recycling - IP moats, not scale.
The Numbers, Tabulated
| Tier | Capital source | Layers | Capex / GW | IRR |
|---|---|---|---|---|
| Tier 1 - Act Now | Private capital | Solar glass, industrial gases, specialty chemicals, encapsulants, aluminium frames, junction boxes, tracking systems, factory software, utility-scale inverters | ₹200-600 cr/GW | 16-30% |
| Tier 2 - Co-Invest | PLI-supported | Cells (TOPCon, HJT), wafers, ingots, test and metrology equipment | ₹1,500-1,800 cr/GW | 6-14% |
| Tier 3 - Sovereign patience | Strategic capital | Polysilicon, manufacturing equipment, tandem perovskite R&D | ₹3,000-8,500 cr/GW | 3-9% |
| Layer | Capex / GW-equivalent | Commission time | Project IRR |
|---|---|---|---|
| Polysilicon | ₹8,500 cr | 5-7 years | 4-9% |
| Solar glass | ₹600 cr | 18-24 months | 16-22% |
| Industrial gases | ₹450 cr | - | 18-26% |
| Specialty chemicals | ₹350 cr | - | 14-20% |
| Encapsulants | ₹200 cr | - | 22-30% |
Illustrative 2026 Techadyant model for a specified crystalline-silicon configuration; shares vary with cell architecture, format and price cycle. Use the workbook sensitivity cases before committing capital.
What to Watch
- 2026-28Phase 1 - Tier 1 materials scale-up (glass, gases, chemicals, encapsulants); PLI Tranche 3 announced, targeting equipment, specialty chemicals and tandem perovskite R&D.
- 2027-28Module oversupply consolidation: 25+ credible Indian module makers fall to 10-12 by 2030; avoid pure-PERC capacity additions post-2027.
- 2028-31Phase 2 - cells, wafers, ingots (TOPCon volume mainstream, HJT premium tier); ALMM extended to cells and progressively to wafers and materials.
- 2031-33Perovskite-silicon tandem crosses 30% cell efficiency at commercial scale; PERC capex stranded; Phase 3 polysilicon and equipment.
- 2035430+ GW cumulative installed; domestic share of build-out 80-90%, but value capture 55-65% (base case) - the deployment-value gap is the decade’s central economic risk.
Frequently Asked Questions
Why is India’s solar story framed as a problem?
India has built one of the world's largest solar-deployment machines - 162.15 GW installed by 30 June 2026 (MNRE) - but deployment has outrun manufacturing depth. Module capacity (~172 GW ALMM-listed) is strong while cells, wafers, polysilicon, specialty chemicals, gases and equipment remain 85-100% imported. Capability inverts value: India is strongest downstream, where value is lowest.
What exactly does India still import?
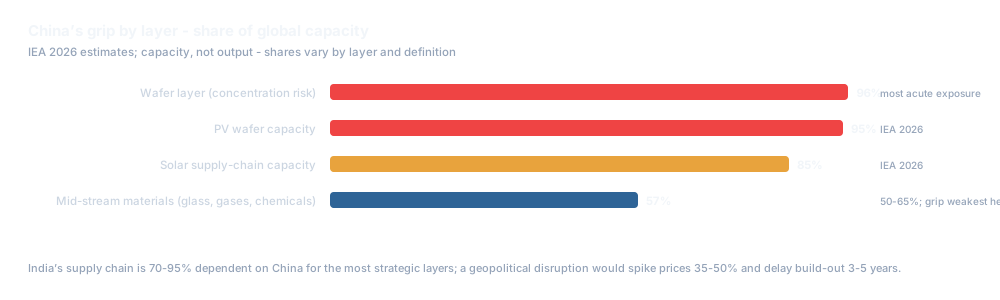
Polysilicon (no domestic capacity), ingots and wafers (~95% of wafer capacity is Chinese), plus specialty chemicals, industrial gases, solar glass and manufacturing equipment. IEA 2026 places China at about 85% of solar supply-chain production capacity; the wafer layer is ~96% concentrated. Mid-stream materials - glass, gases, chemicals - are the exception at 50-65% Chinese share.
What should India localise first?
Tier 1 mid-stream materials: solar glass (16-22% IRR at ₹600 cr/GW), industrial gases (18-26% at ₹450 cr), specialty chemicals (14-20% at ₹350 cr) and encapsulants (22-30% at ₹200 cr). These clear the private-equity hurdle today. Polysilicon - the conventional priority - is the least attractive first move: ₹8,500 cr/GW, 5-7 years, 4-9% IRR.
How much capital, and where?
The report recommends inverting current allocation: 35% of solar-manufacturing capex to Tier 1 materials, 40% to Tier 2 cells/wafers/ingots (PLI-supported, where sovereignty is won), 18% to Tier 3 polysilicon/equipment/tandem R&D (sovereign-backed), and 7% to cross-cutting research, test infrastructure and standards.
Is the 5-7 year window real?
Yes - and it narrows after 2030 from three directions: the perovskite-silicon tandem transition resets equipment and materials requirements, Western tariff regimes compress Chinese export volumes and accelerate consolidation, and Chinese costs rise. Localisation is robust across all three scenarios - Status Quo (60%), Geopolitical Disruption (25%) and Technology Inflection (15%).
What should startups build?
Factory intelligence, inspection and metrology equipment, and module recycling. These are software-and-engineering-intensive niches with moderate capital needs (₹100-400 cr), where the moat is IP rather than scale, and where Indian engineering talent is globally competitive. Avoid commodity layers like modules where Chinese cluster economics dominate.
Sources & Methodology
Derived from Beyond Solar Panels Edition v2.1 (2026). External facts are traced to dated sources; modelled outputs are labelled; projections are scenarios. Primary sources:
- MNRE physical-progress data, 30 June 2026 (162.15 GW); PIB release on 150.26 GW at 31 March 2026 and ~172 GW ALMM module capacity [Verified]
- MNRE PLI scheme: Tranche I ₹4,500 cr / 8,737 MW; Tranche II ₹19,500 cr / 39,600 MW [Verified]
- 2025 Budget explanatory memorandum: 20% BCD + 20% AIDC on solar cells and modules from 2 Feb 2025 [Verified]
- IEA Energy Technology Perspectives 2026: ~85% supply-chain and ~95% wafer capacity in China [Verified]
- CEA National Electricity Plan (364.6 GW solar, 2031-32); company filings; NREL cost benchmarks; BNEF Tier-1 survey [Verified]
- Techadyant Labs localisation-economics model and investment-tiering framework [Model]
Get the Full Report
144-page PDF · 13 chapters · 53 tables · 22 exhibits · companion Excel workbook with the full model and source data (Report + Data pack).
Buy Report - ₹6,999Report + Data pack - ₹9,999Free Condensed Edition
22 pages - the thesis, the frameworks and the headline findings, with figures.
22-page condensed edition (PDF). Free to read here; subscribe with an email to download the PDF. We'll also tell you when this assessment changes.
Free · no spam · unsubscribe anytime · privacy policy